
Figure 2.
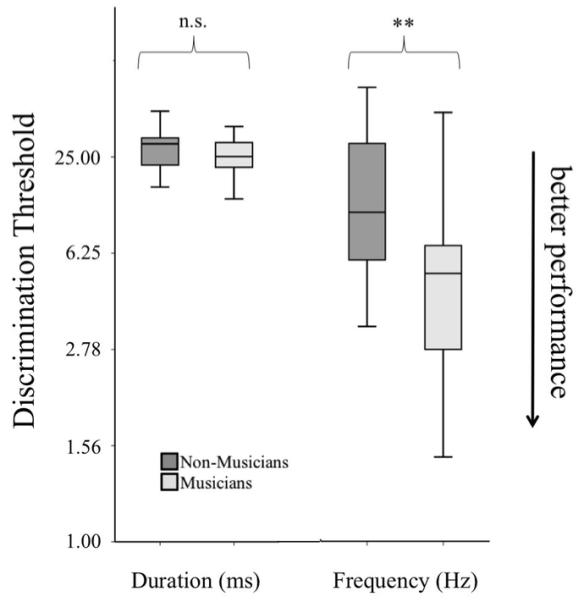
Boxplots illustrating performance on the duration and frequency discrimination tasks separated by group, * = p < .05, ** = p < .001. Note the different units for duration (ms) and frequency (Hz) measures. Lower thresholds indicate better performance.