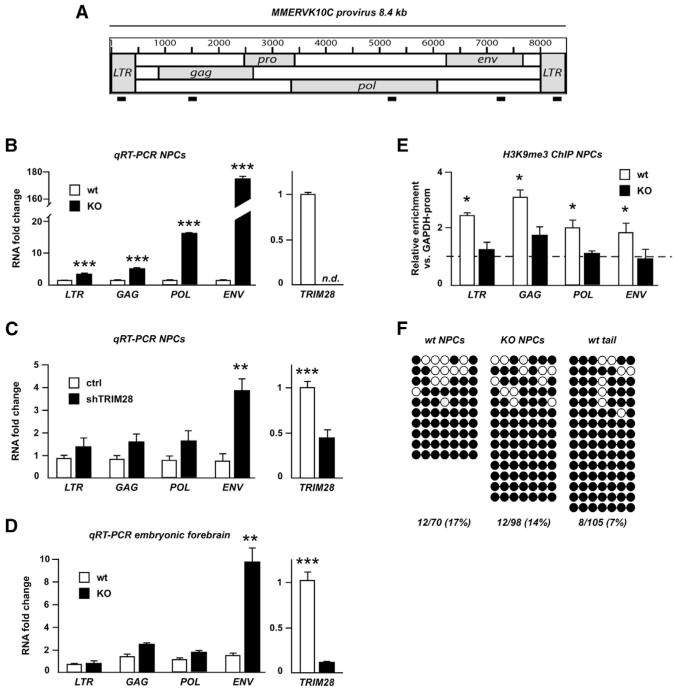
Figure 2. Analysis of the Putative MMERVK10C Provirus.
(A) Schematic drawing of the MMERVK10C provirus and approximate primer positions.
(B) Quantitative analysis of transcript levels of different regions of the MMERVK10C provirus in Trim28−/− and wild-type NPCs.
(C) qRT-PCR analysis of MMERVK10C following TRIM28-shRNA knockdown.
(D) qRT-PCR analysis of E13.5 forebrain dissected from intercrosses of NestinCre Trim28floxed mice.
(E) ChIP for H3K9me3 in Trim28−/− and wild-type NPCs.
(F) Bisulfite sequencing analysis of the 3′ end region of MMERVK10C. Empty and full circles represent unmethylated and methylated CpGs, respectively.
Data are presented as mean of relative values ± SEM. *p < 0.05, Student’s t test.

