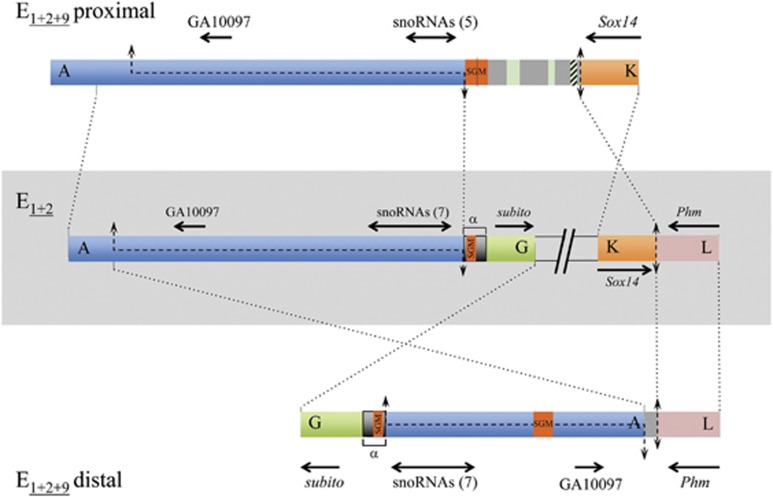
Figure 3.
E9 inversion breakpoints. Schematic representation of the E9 inversion breakpoint regions on E1+2 and E1+2+9 arrangements with breakpoints labeled as in Figure 1. Thick colored bars represent the different breakpoint regions. The central part shows, within a light gray rectangle, the scheme of both breakpoints of the E9 inversion in gene arrangement E1+2 (AG and KL), separated by two inclined lines. Schemes of the proximal and distal breakpoints in gene arrangement E1+2+9 (AK and GL) are represented above and below, respectively, of the E1+2 scheme. The lengths of the four sequenced breakpoint regions are AG, ~14.4-kb; KL, ~3.8-kb; AK, ~17.0-kb; and GL, ~13.0-kb. Black discontinuous lines along a chromosomal region represent staggered breaks with their limits indicated by arrows. Vertical double-headed arrows indicate cut-and-paste breakpoints. Dotted lines between arrangements indicate the limits and orientation of homologous regions. On each flanking region, the names of the orthologous coding regions in either D. melanogaster or D. pseudoobscura are given, with black arrows indicating their sense and approximate size. Double-headed horizontal arrows refer to the multiple snoRNAs generated from the corresponding Uhg gene introns, with their number given in parenthesis. Orange boxes labeled SGM refer to either near canonical copies of the SGM transposable element, or remnants thereof within a larger repeat sequence named α-motif in Puerma et al. (2014) and marked with an α. Gray regions present in the E9 breakpoints (AK and GL) in the E1+2+9 arrangement are intervening regions not present in any of the E1+2 breakpoint regions that in the proximal breakpoint present different-sized fragments of the gypsy (green) and Pao (striped green) transposable elements.

