. 2015 Apr 23;4:e06967. doi: 10.7554/eLife.06967

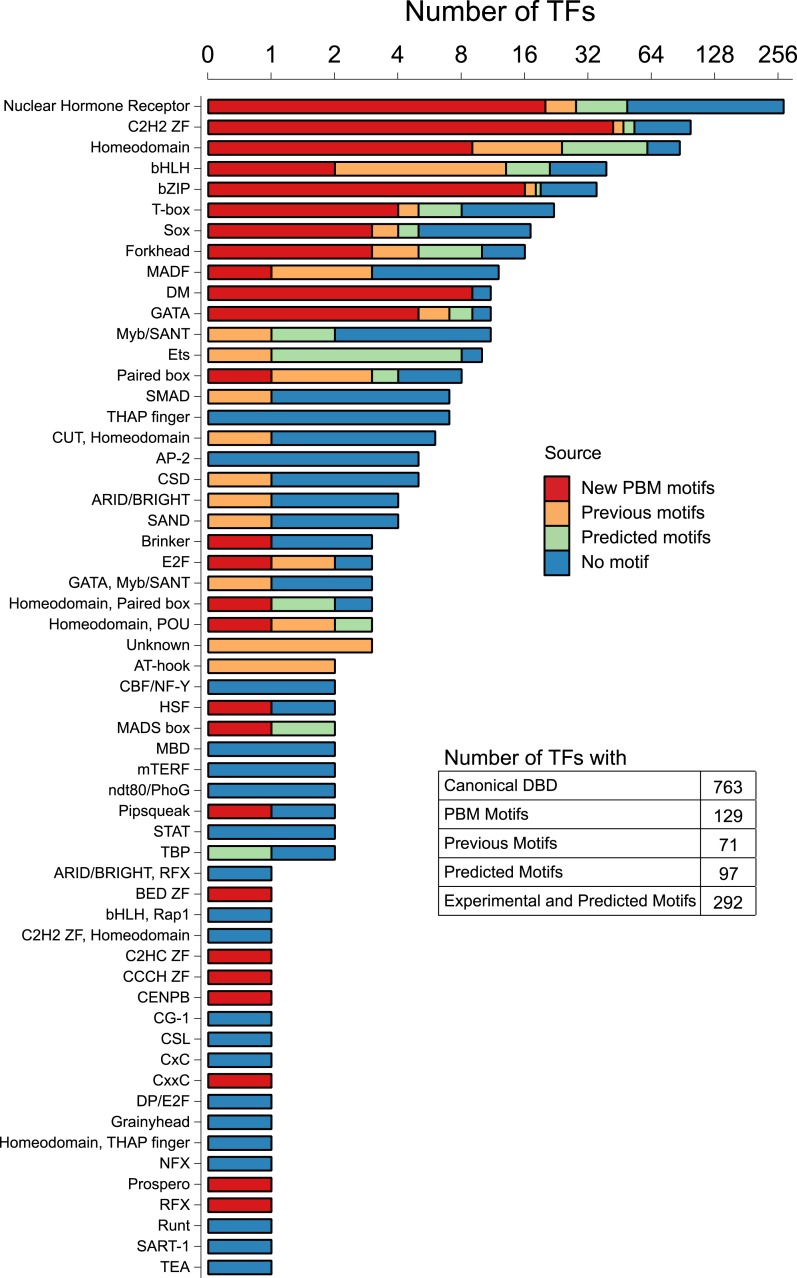
Figure 1. Motif status by DBD class.

Stacked bar plot depicting the number of unique C. elegans Transcription factors (TFs) for which a motif has been derived using PBM (this study), previous literature (including PBMs), or by homology-based prediction rules (see main text). The y-axis is displayed on a log2 scale for values greater than zero. See Figure 1—source data 1 for DNA-binding domain (DBD) abbreviations. Correspondence between motifs identified in current study and previously reported motifs is shown in Figure 1—figure supplement 1.

DOI: http://dx.doi.org/10.7554/eLife.06967.003

Figure 1—source data 1. Table of C. elegans TF repertoire motif coverage and list of TF DBDs present in C. elegans.
The number of unique C. elegans TFs by DNA-binding domain family for which a motif has been derived using PBM (this study), previous literature (including PBMs), or by homology-based prediction rules and the list of C. elegans TFs by DNA-binding domain family type.
elife06967s001.xlsx (20.9KB, xlsx)
DOI: 10.7554/eLife.06967.004

Figure 1.

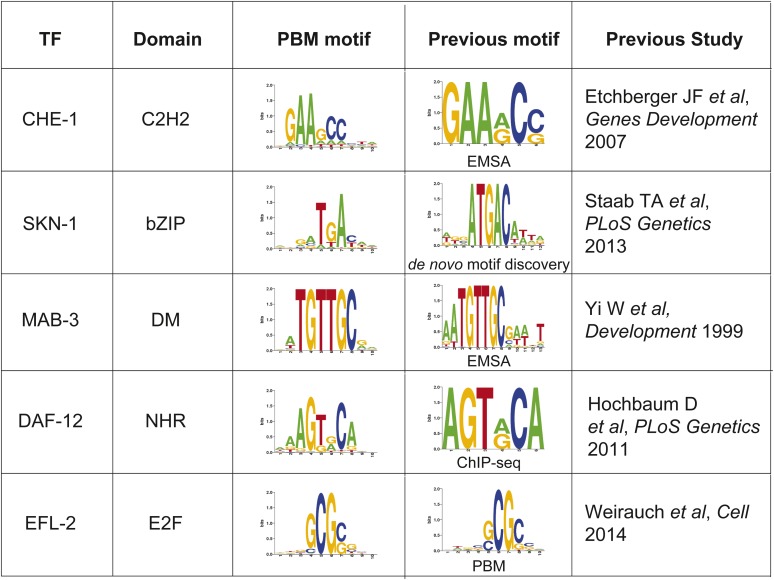
Figure 1—figure supplement 1. Correspondence between TF motifs identified from our PBM study and previously reported motifs from several types of experimental data.

Figure 1—figure supplement 1.