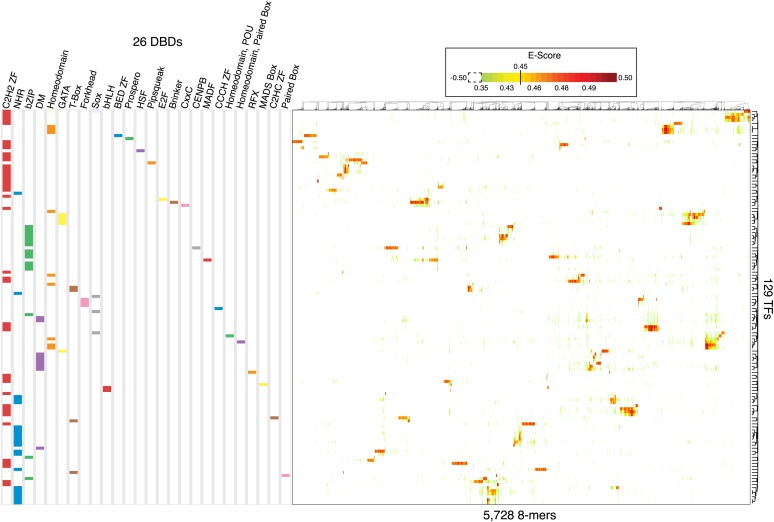
Figure 3. Overview of 8-mer sequences preferences for the 129 C. elegans TFs analyzed by PBM in this study.
2-D Hierarchical agglomerative clustering analysis of E-scores performed on all 5728 8-mers bound by at least one TF (average E > 0.45 between ME and HK replicate PBMs). Colored boxes represent DBD classes for each TF. Average E-score data is available in Figure 3—source data 1.
DOI: http://dx.doi.org/10.7554/eLife.06967.012

