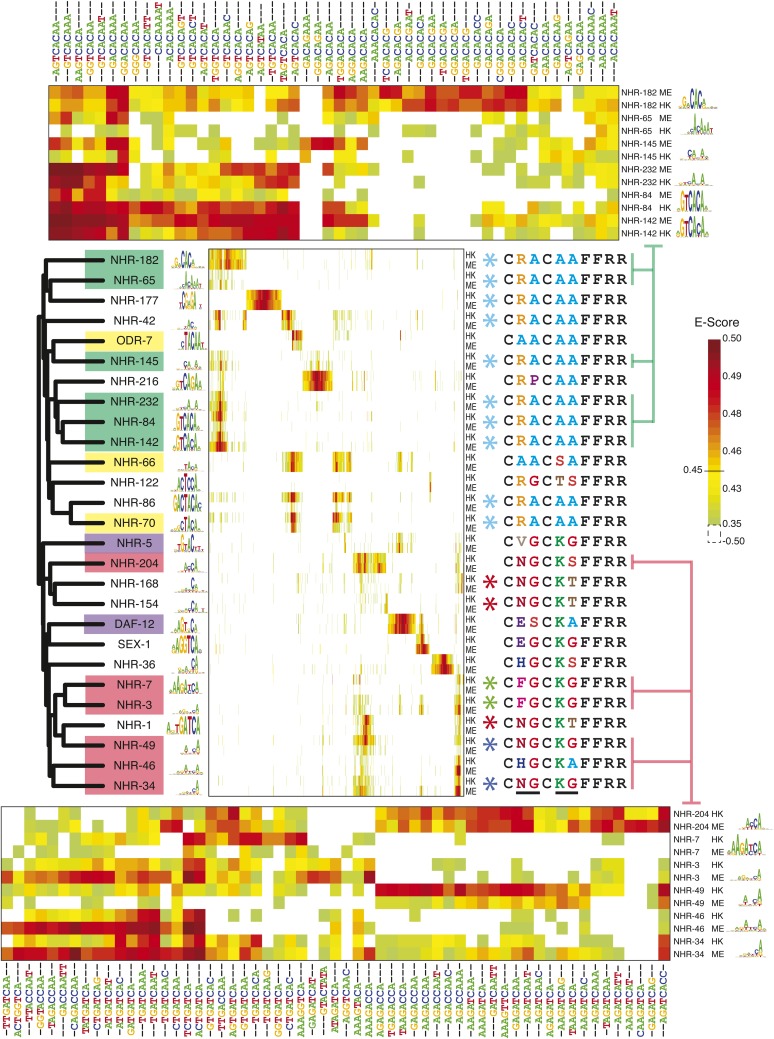
Figure 4. 8-mer binding profiles of NHR family reveal distinct sequence preferences.
Left, ClustalW phylogram of nuclear hormone receptor (NHR) DBD amino acid sequences with corresponding motifs. TF labels are shaded according to motif similarity groups identified by PWMclus. Center, heatmap showing E-scores. NHRs are ordered according to the phylogram at left. The 1406 8-mers with E-score > 0.45 for at least one family member on at least one PBM array were ordered using hierarchical agglomerative clustering. Each TF has one row for each of two-replicate PBM experiments (ME or HK array designs). Right; recognition helix (RH) sequences for the corresponding proteins, with identical RH sequence types highlighted by colored asterisks. Variant RH residues are underlined at bottom. Right, matrix indicates cluster membership according to PWMclus. Top and bottom, pullouts show re-clustered data including only the union of the top ten most highly scoring 8-mers (taking the average E-score from the ME and HK arrays) for each of the selected proteins. E-scores for k-mers in all three heatmaps are available in Figure 4—source data 1.
DOI: http://dx.doi.org/10.7554/eLife.06967.014

