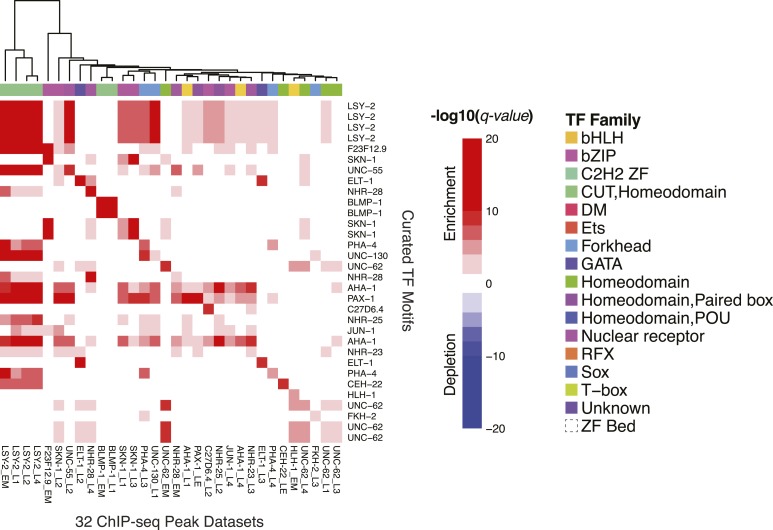
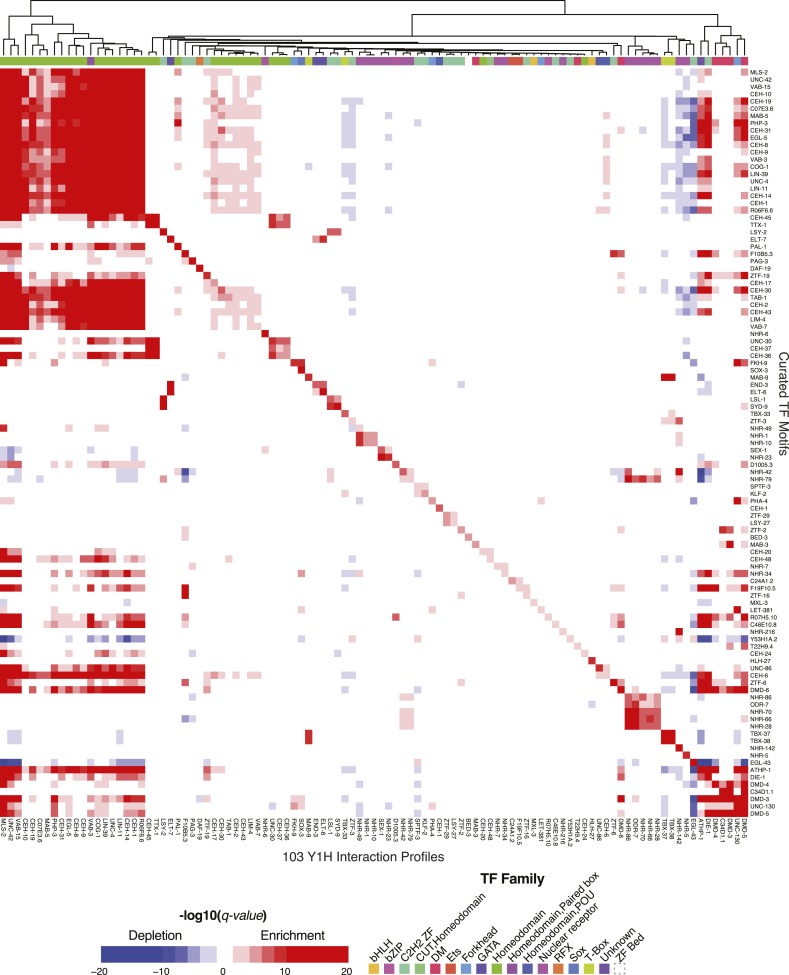
Figure 7. The C. elegans curated motif collection explains ChIP-seq and Y1H TF binding data.
Heatmap of CentriMo −log10 (q-values) for central enrichment of TF motifs in the top 250 peaks for each ChIP experiment. Motif enrichment in Y1H data is presented in Figure 7—figure supplement 1. Both ChIP-seq and Y1H heatmaps use a common colour and annotation scale. Heatmaps are symmetric with duplicate rows to ensure the diagonal represents TF-motif enrichment in it's matching data set(s). Red and blue coloring depicts statistically significant enrichments and depletions (q ≤ 0.05).


