. 2015 Apr 23;4:e06967. doi: 10.7554/eLife.06967

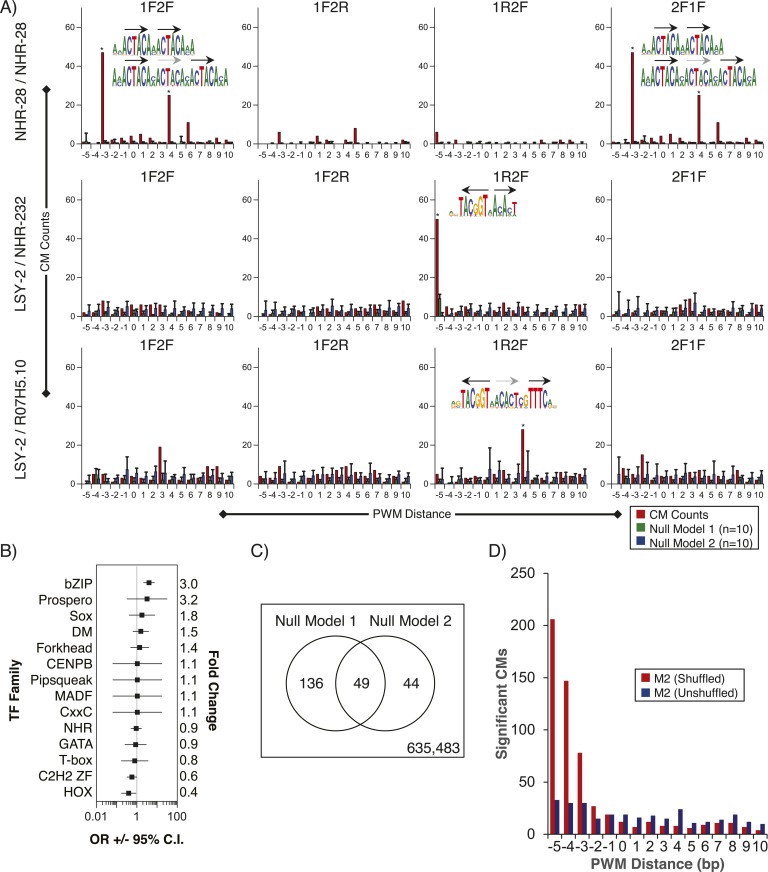
Figure 8. Composite motifs enriched in C. elegans ChIP-seq peaks.

(A) Stereospecificity plots showing enriched CM configurations for pairs of TF motifs. The identical ‘1F2F’ and ‘2F1F’ results in A (top row) demonstrate homodimer and homotrimer CMs, while those involving LSY-2, NHR-232, and R07H5.10 demonstrate heterodimer and heterotrimer CMs (middle and bottom rows, respectively). Black arrows represent orientation of the motif within CMs, while gray dashed arrows designate shadow motifs within trimeric CMs. Error bars are ± S.D., *corrected p < 0.05. (B) Forest plot of odds ratios for TF family enrichment in CMs vs input TF list. (C) Venn diagram showing overlap of significant CMs identified by null model 1 (dinucleotide shuffled sequence) and null model 2 (motif shuffling). (D) Number of significant CMs identified relative to dinucleotide scrambled sequences using shuffled and non-shuffled non-ChIPed motifs, as a function of motif pair distance.

DOI: http://dx.doi.org/10.7554/eLife.06967.023

Figure 8—source data 1. Table displaying enrichment statistics, spacing and orientations between PWMs for CMs identified in modENCODE ChIP-seq data.
elife06967s005.xls (74.5KB, xls)
DOI: 10.7554/eLife.06967.024

Figure 8.

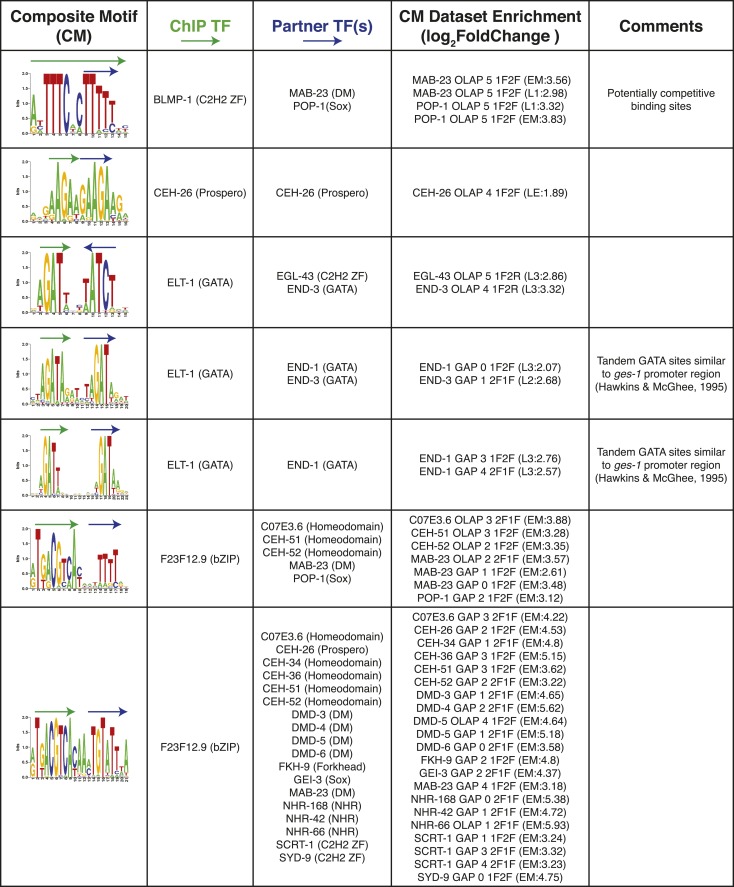
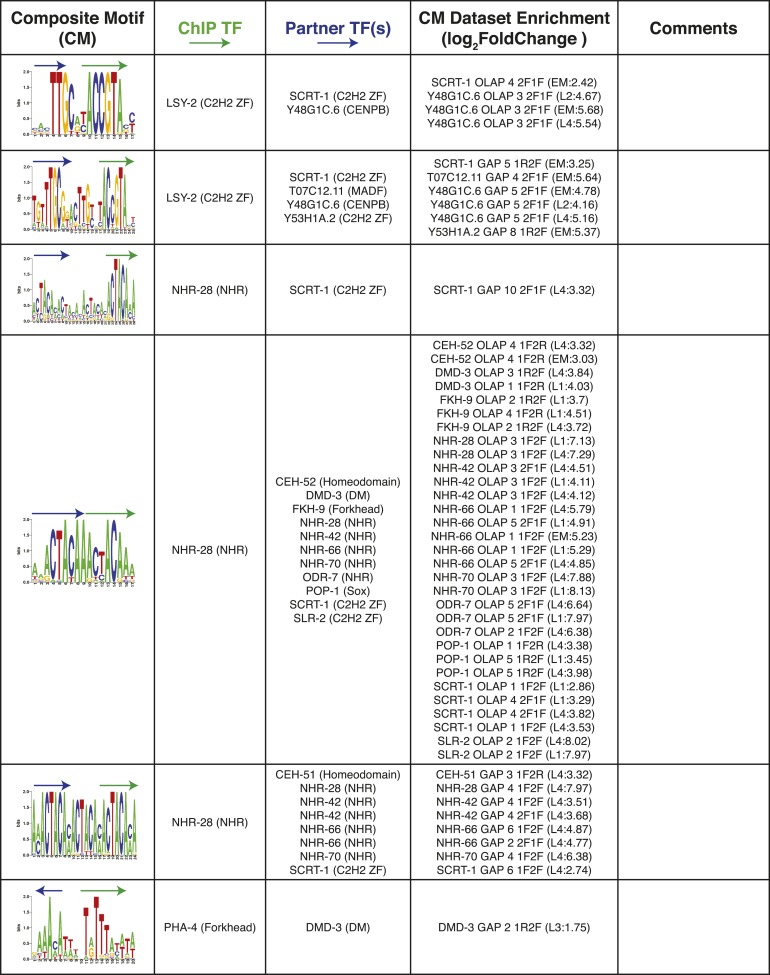
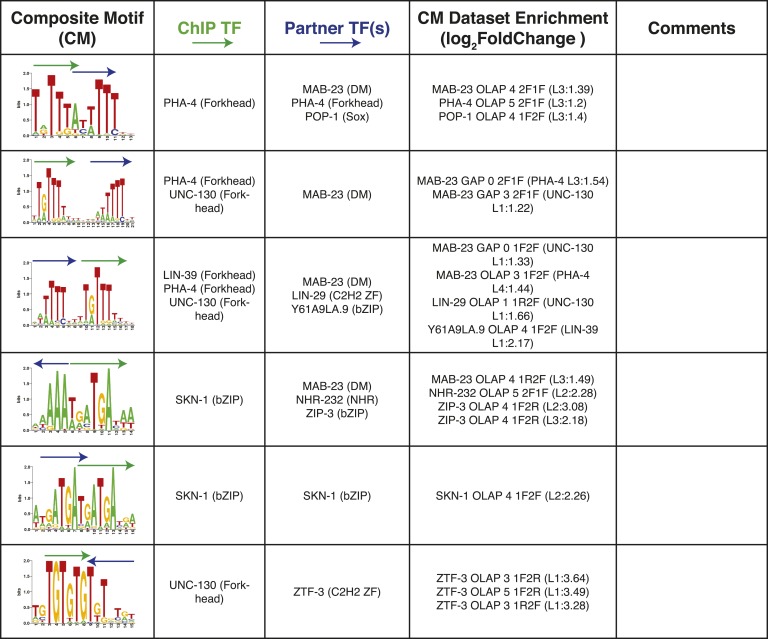
Figure 8—figure supplement 1. Summary of clustered CMs enriched in C. elegans ChIP-seq peaks.

Figure 8—figure supplement 1.

CM-cluster centroids are shown for the enriched motifs. For each cluster, the ChIPed TF(s) and potential partner TF(s) are listed along with information about motif overlap (OLAP), spacing (GAP), and enrichment. Colored arrows over motif indicate high-information content portions of either factor.
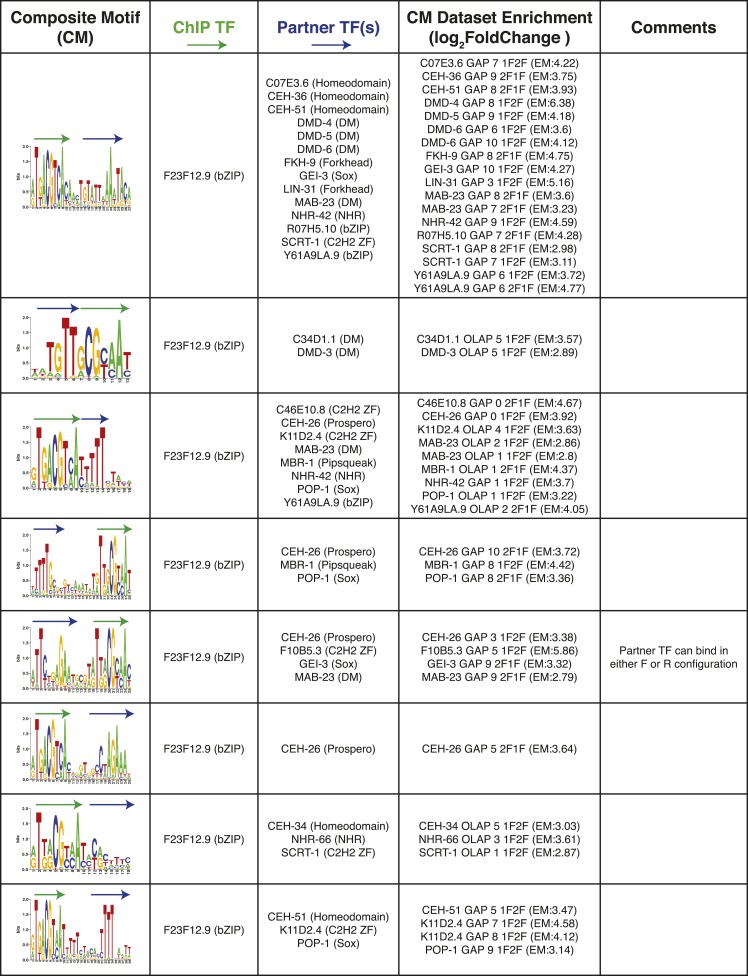
Figure 8—figure supplement 2. Summary of clustered CMs enriched in C. elegans ChIP-seq peaks (continued).

Figure 8—figure supplement 2.

CM-cluster centroids are shown for the enriched motifs. For each cluster, the ChIPed TF(s) and potential partner TF(s) are listed along with information about motif overlap (OLAP), spacing (GAP), and enrichment. Colored arrows over motif indicate high-information content portions of either factor.
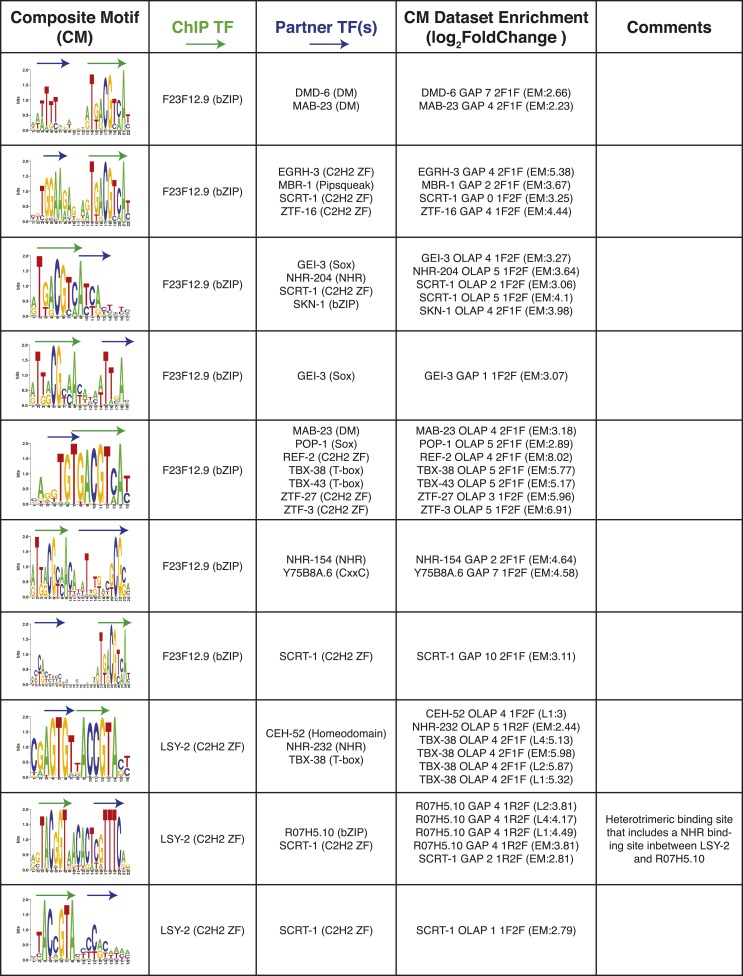
Figure 8—figure supplement 3. Summary of clustered CMs enriched in C. elegans ChIP-seq peaks (continued).

Figure 8—figure supplement 3.

CM-cluster centroids are shown for the enriched motifs. For each cluster, the ChIPed TF(s) and potential partner TF(s) are listed along with information about motif overlap (OLAP), spacing (GAP), and enrichment. Colored arrows over motif indicate high-information content portions of either factor.
Figure 8—figure supplement 4. Summary of clustered CMs enriched in C. elegans ChIP-seq peaks (continued).

Figure 8—figure supplement 4.

CM-cluster centroids are shown for the enriched motifs. For each cluster, the ChIPed TF(s) and potential partner TF(s) are listed along with information about motif overlap (OLAP), spacing (GAP), and enrichment. Colored arrows over motif indicate high-information content portions of either factor.
Figure 8—figure supplement 5. Summary of clustered CMs enriched in C. elegans ChIP-seq peaks (continued).

Figure 8—figure supplement 5.

CM-cluster centroids are shown for the enriched motifs. For each cluster, the ChIPed TF(s) and potential partner TF(s) are listed along with information about motif overlap (OLAP), spacing (GAP), and enrichment. Colored arrows over motif indicate high-information content portions of either factor.