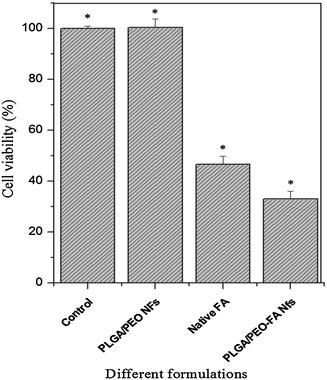
Fig. 8.

Colorimetric MTT viability assay for MCF-7 cells treated with different formulations coverslips (control), PLGA/PEO nanofibers, native FA (in solution form) and FA-encapsulated PLGA/PEO nanofibers after 24 h at 570 nm. Error bars represent mean ± standard deviation for three independent experiments (n = 3). *p < 0.05 indicates statistical significant difference as compared to control. (Nfs nanofibers)
