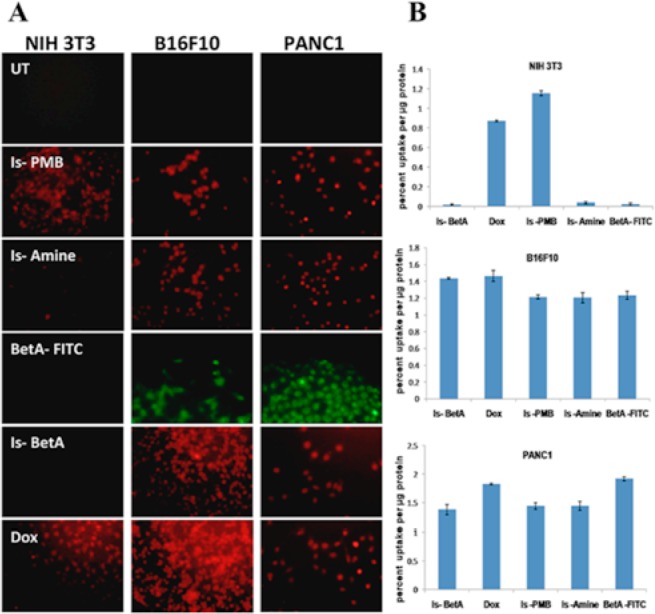
Figure 1.

(A) Fluorescence images of normal cells (NIH 3T3) or cancer cells (B16F10, PANC1) either kept untreated (UT) or treated with Is-PMB, Is-amine, BetA-FITC, Is-BetA, and Dox, respectively. (B) Quantitative uptake of Is-BetA, Dox, Is-PMB, Is-amine, and Bet-FITC in cells as depicted. The data is represented as percentage of fluorescent molecules’ uptake per microgram of protein.
