Figure 2.

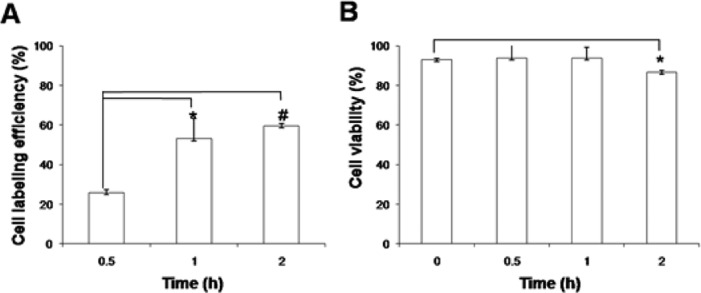
Cell labeling efficiency and cell viability with time. (A) Cell labeling efficiency of 1 with ADSCs for 2 h. (B) Cell viability of 1-labeled ADSCs for 2 h. Error bars denote the standard deviation (n = 3). *P < 0.05; #P < 0.001.

Cell labeling efficiency and cell viability with time. (A) Cell labeling efficiency of 1 with ADSCs for 2 h. (B) Cell viability of 1-labeled ADSCs for 2 h. Error bars denote the standard deviation (n = 3). *P < 0.05; #P < 0.001.