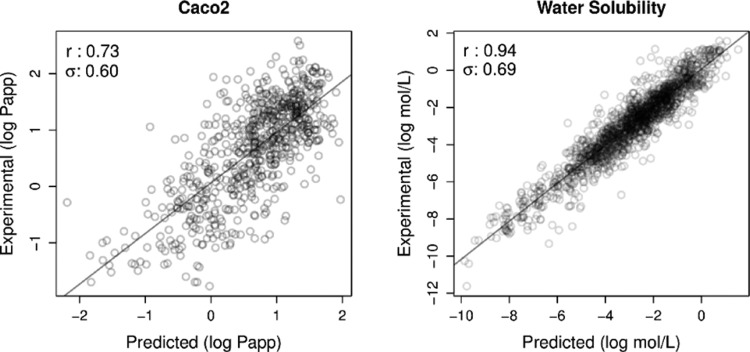
Figure 2.
Regression analysis for absorption predictors considering cross-validation schemes. Pearson’s correlation coefficients and standard error are also shown at the top-left corner. The left graph shows the correlation between experimental and predicted values for Caco2 permeability, while the graph on the right for water solubility.

