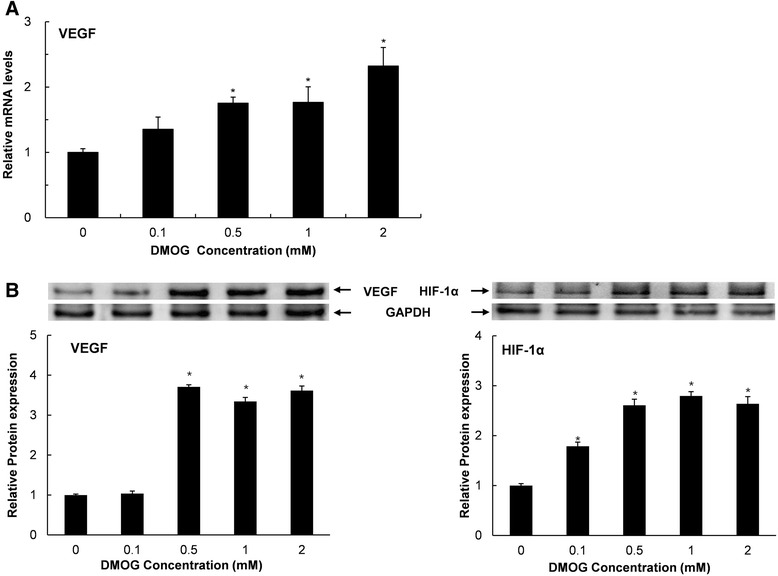
Fig 3.

mRNA expression of the VEGF gene and protein expression of VEGF and HIF-1α in DMOG-treated cells. RP cells were treated with DMOG at concentrations ranging from 0 to 2 mM for 24 h. Data and error bars indicate means ± SD of three independent experiments. *demonstrates mRNA (A) and protein (B) expression levels that are significantly different from those of untreated control cells (P < 0.05)
