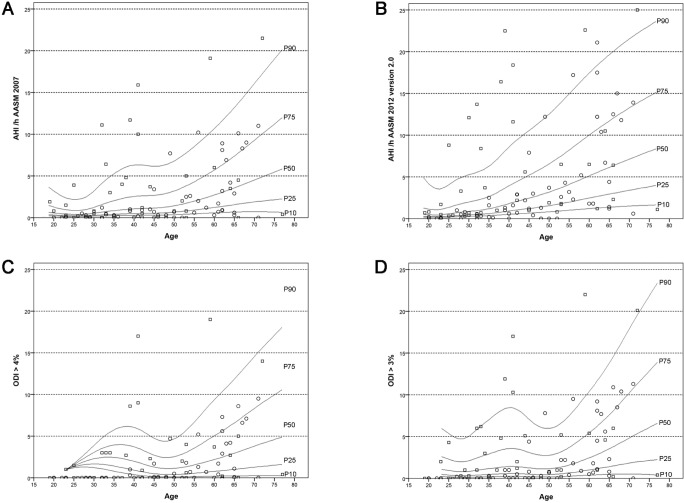
Figure 2.
Age-related percentile curves of the apnea-hypopnea index (AHI) and the oxygen desaturation index (ODI) according to AASM 2007 and AASM 2012 version 2.0 criteria. (A) AHI according to AASM 2007. (B) AHI according to AASM 2012 version 2.0. (C) ODI > 4%. (D) ODI > 3%. Circles represent women, squares represent men; figures show 10th, 25th, 50th, 75th, and 90th percentile.

