
Figure 4.
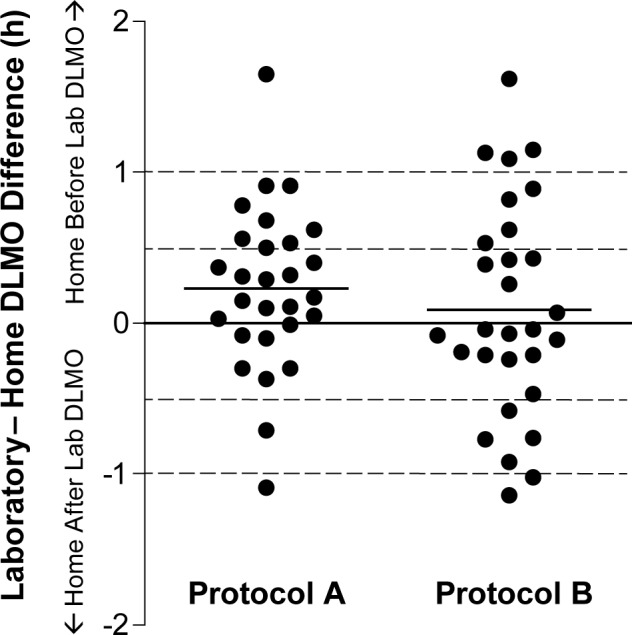
The distribution of the difference between the laboratory dim light melatonin onsets (DLMOs) and home DLMOs, calculated by subtracting each home DLMO from its corresponding laboratory DLMO. The zero line represents no difference between the DLMOs, a positive difference reflects the home DLMO occurring earlier in time than the corresponding laboratory DLMO, while a negative difference reflects the home DLMO occurring after the corresponding laboratory DLMO. The solid lines represent the mean differences in each protocol. The dashed lines represent a 30-min difference and a 1-h difference between the home and laboratory DLMOs.