Figure 2.
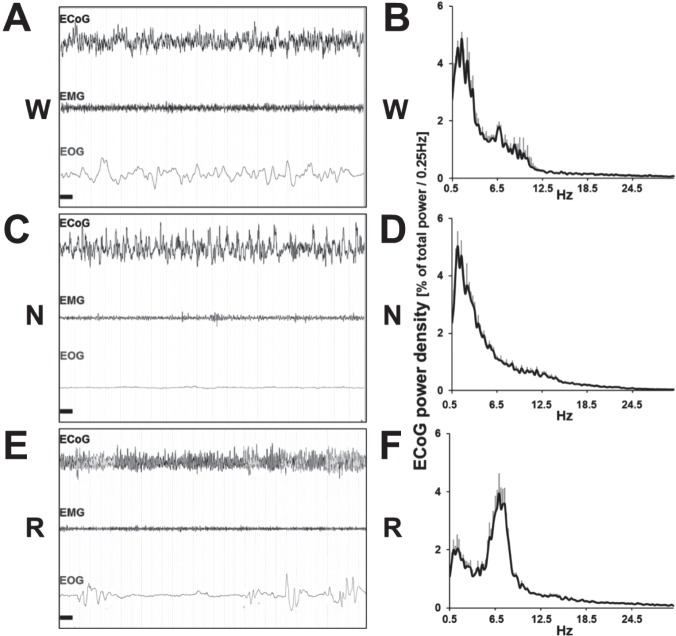
Samples of polygraphic recordings and electroencephalography (EEG) power spectrum profile in wake, non-rapid eye movement (NREM) sleep, and rapid eye movement (REM) sleep under baseline condition. Samples of EEG, electromyography (EMG), and electrooculography (EOG) recordings obtained during baseline 12hL:12hD condition: (A) During waking a desynchronized EEG pattern occurs in parallel with high levels of EOG and EMG activities. (B) Power spectrum analysis of all waking epochs during baseline. Peaks are noticed in both the delta (0.5–4 Hz) and theta (6–10 Hz) ranges. (C) Recordings during NREM sleep show synchronized slow-wave activity oscillations in the EEG, with a near complete suppression of EMG and EOG activity. (D) Spectral profile is dominated by delta frequencies. (E) During REM sleep a desynchronized EEG pattern emerges with a total flattening of the EMG, reflecting the atonic state of the animal. Rapid eye movements are indicated by EOG activity. (F) Power spectrum profile is dominated by theta activity. Graph represents peak relative frequencies of total power between 0.5–25 Hz and standard error of the mean. Horizontal black bars: 1 sec, window represents 20 sec of recording. N, non-rapid eye movement; R, rapid eye movement; W, wake.

