Figure 6.
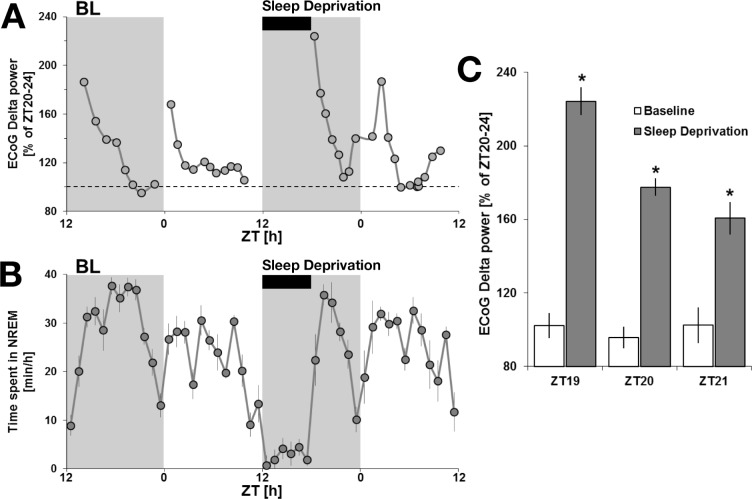
Non-rapid eye movement (NREM) sleep and electroencephalography (EEG) delta power under sleep deprivation at ZT12. (A) EEG delta power expressed as a percentage of ZT20-ZT24 during baseline (ZT20-ZT24 was determined to consistently be the period with the lowest sleep pressure). The 6-h sleep deprivation is displayed as well as the preceding baseline day. (B) NREM sleep amounts under baseline conditions are at the maximum level at ZT 18. The rebound of NREM following the 6-h sleep deprivation occurs at ZT 18, which more likely explains why NREM amounts following a 6-h sleep deprivation stay within the baseline range. However, the peak of EEG delta power reached after sleep deprivation, a more reliable marker of the homeostatic process, is increased compared to baseline values. (C) Histograms representing EEG delta power during the first 3 h of recovery after the sleep deprivation as compared to the same baseline ZT (n = 8). A repeated-measures analysis of variance for baseline versus sleep deprivation and time-course showed significance. Asterisks denote significant differences following post hoc protected least significant difference (P < 0.05). BL, baseline; ZT, Zeitgeber time.

