
Figure 3.
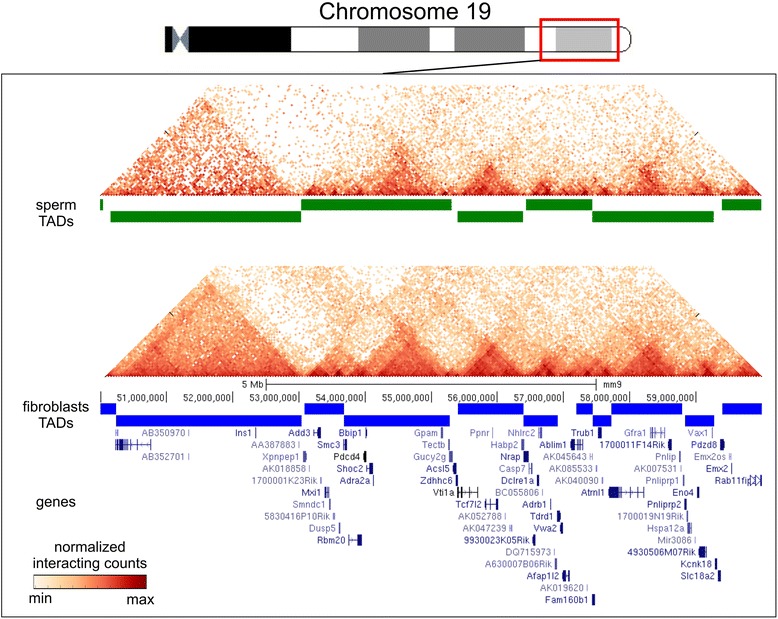
TADs are present in fibroblasts and sperm cells. The TAD signal is shown as a green line (for sperm cells) or a blue line (for fibroblasts) for a region on chromosome 19. The fragments of the heatmaps for sperm cells and fibroblasts (binned at a resolution of 40 kb) display the enrichment of contacts inside the TAD domains. The TAD signal shows visible similarity between sperm cells and fibroblasts.