Figure 1.
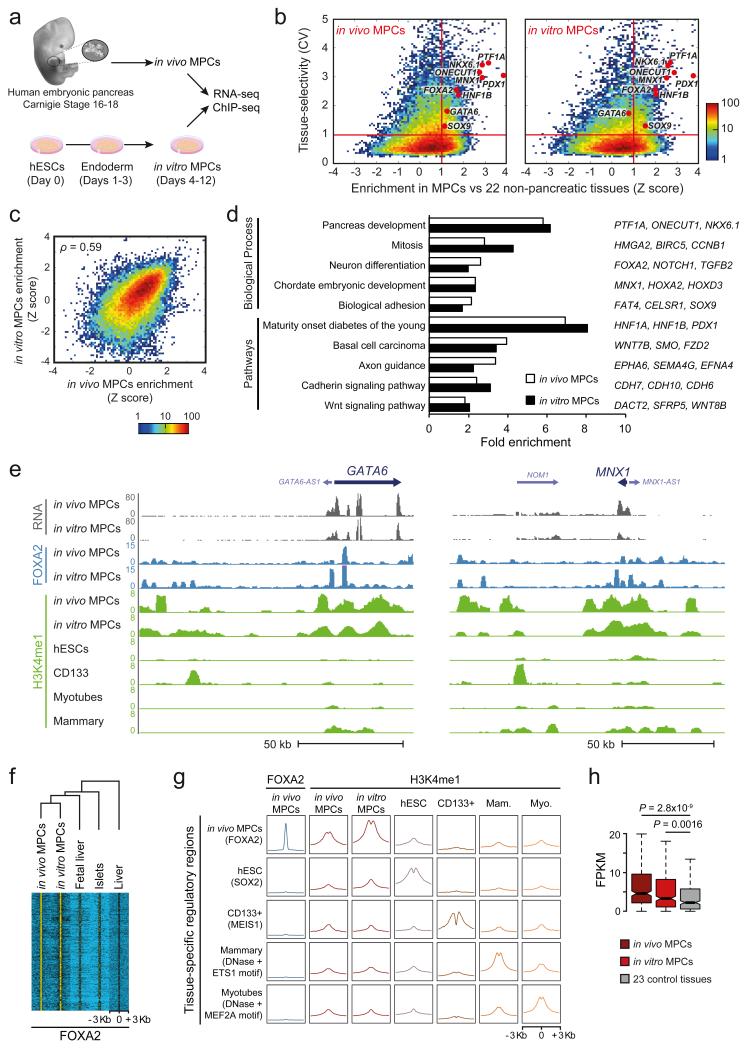
Human in vitro MPCs recapitulate transcriptional and epigenomic features of in vivo MPCs. (a) Experimental set-up. Pancreas was dissected from human Carnegie stage 16-18 embryos (in vivo MPCs). In vitro MPCs were derived from hESCs. (b) In vitro and in vivo MPCs share tissue-selective genes. Tissue-selectivity of RNAs was determined by the coefficient of variation (CV) across 25 embryonic and adult tissues or cell types. Enrichment of RNAs in MPCs relative to non-pancreatic tissues was quantified as a Z-score. Red lines define genes that are both tissue-selective and enriched in MPCs (CV>1, Z>1). Most known pancreatic regulatory TFs are in this quadrant in both sources of MPCs. Color scale depicts number of transcripts. (c) Z-scores of genes expressed in at least one source of MPCs were highly correlated for in vitro vs. in vivo MPCs (see also Supplementary Figure 1d for a comparison of unrelated tissues). Spearman's coefficient value is shown. Color scale depicts number of transcripts. (d) In vivo and in vitro MPC-enriched genes have common functional annotations. Shown are most significant terms for in vivo MPC-enriched genes, and their fold enrichment in both sources of MPCs. Representative genes from each category that are enriched in both MPCs are shown on the right. More extensive annotations are shown in Supplementary Table 3. (e) RNA, FOXA2 and H3K4me1 profiles of indicated samples in the GATA6 and MNX1 loci. (f) In vivo MPC FOXA2 occupancy is largely recapitulated by in vitro MPCs, but not by other tissues expressing FOXA2. Hierarchical clustering was performed on normalized FOXA2 ChIP-seq signal centered on all 5,760 in vivo MPC FOXA2 peaks. (g) In vitro MPCs recapitulate cell-specific H3K4me1 enrichment observed in chromatin from in vivo MPCs. Aggregation plots show H3K4me1 enrichment at occupancy sites of tissue-specific TFs. Mam.: Mammary Myo.: Myotubes. (h) Genes with ≥3 regions enriched in FOXA2 and H3K4me1 at in vivo MPCs are preferentially expressed in both in vivo and in vitro MPCs. Boxes show RNA interquartile range (IQR) and notches indicate median 95% confidence intervals (n=327 genes). P values were calculated with Wilcoxon rank-sum test.

