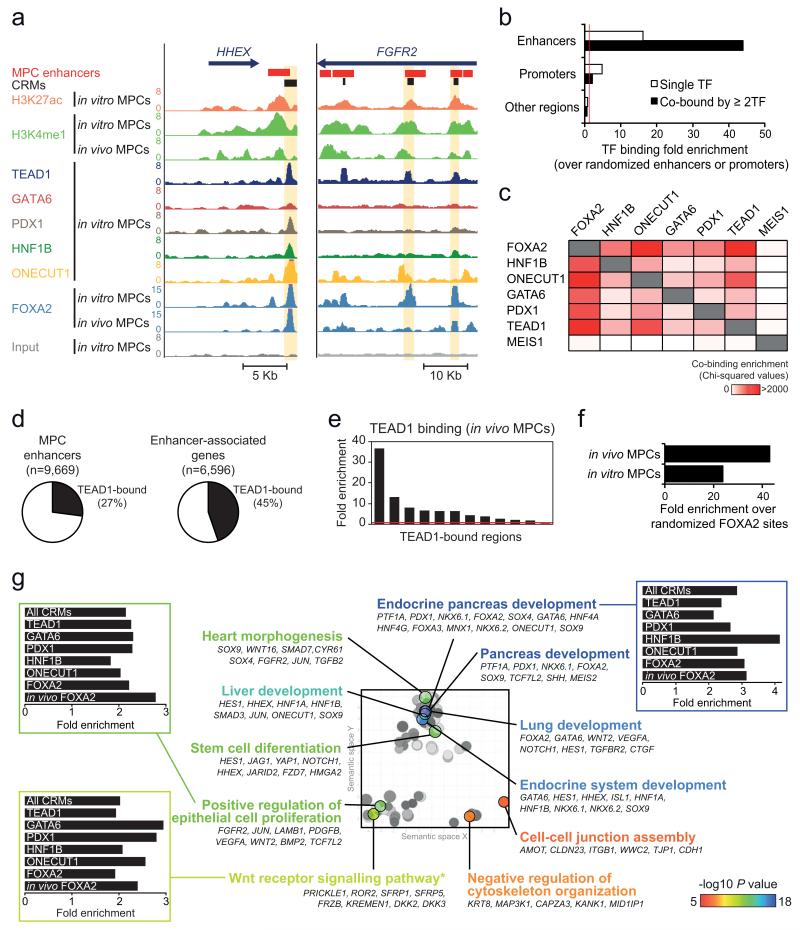
Figure 4.
TEAD1 is a core component of human pancreatic MPC cis-regulatory modules (CRMs). (a) ChIP-seq was used to locate binding sites of 6 TFs in MPCs, as illustrated in two loci encoding pancreatic TFs. CRMs were defined as enhancer regions with ≥2 overlapping TF-bound sites. Examples are highlighted in yellow. (b) TFs preferentially occupy MPC enhancers, and this is most pronounced for regions bound by ≥2 TFs. Binding enrichment was calculated over 1,000 permutations of enhancer or promoter genomic positions in the mappable genome. For comparison we analyzed all other genomic regions after exclusion of MPC enhancers or promoters. Red line indicates a fold enrichment of 1. (c) Pancreatic TFs co-occupy genomic regions, and TEAD1 shows a similar co-occupancy pattern as other known pancreatic TFs. Binding sites of MEIS1 in a non-pancreatic cell type were used as control. The heatmap depicts Chi-squared values for all pairwise comparisons of observed vs. expected co-binding. The latter was estimated by permuting each set of TF peaks independently 1,000 times. (d) Over 1/4 of MPC enhancers are bound by TEAD1, whereas 45% of genes associated with MPC enhancers include at least one TEAD1-bound enhancer. (e) ChIP-qPCR with in vivo MPCs confirms TEAD1 binding at in vitro MPC TEAD1-bound regions (regions and associated genes in Supplementary Table 15). (f) TEAD1 binding is enriched in regions bound by FOXA2 in either in vitro or in vivo MPCs. We calculated TEAD1-FOXA2 co-binding over the median expected value after generating 1,000 permutations of in vitro or in vivo FOXA2 peak positions. (g) CRMs underlie a pancreas developmental regulatory network. The 2,956 genes associated with CRMs were functionally annotated using GREAT45, and REVIGO46 was used to visualize annotation clusters. The most significant terms from each cluster are highlighted according to the P value color scale. Bar graphs show that GO terms are similarly enriched in CRMs bound by different TFs. *Several WNT pathway related-terms were enriched, although manual annotation in this category revealed that most gene were either non-canonical WNT signaling mediators or antagonists of canonical WNT signaling (full annotations in Supplementary Table 17).

