
Figure 1.
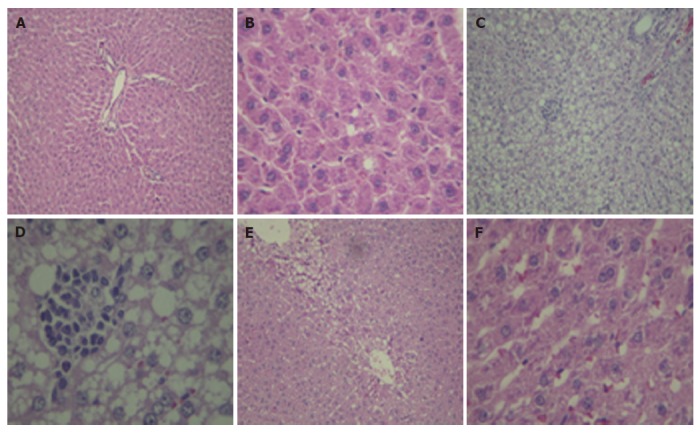
Hematoxylin and eosin staining of liver tissue. A, B: control; C, D: NASH, fed with 100% fat diet group showed macrovesicular steatosis, ballooning changes, Mallory bodies, hepatocyte necrosis, and infiltration of inflammatory cells; E, F: NASH + NAC20, showed the improvement in steatosis and necroinflammation (A, C, E: × 10; B, D, F: × 40 ).