Figure 1.

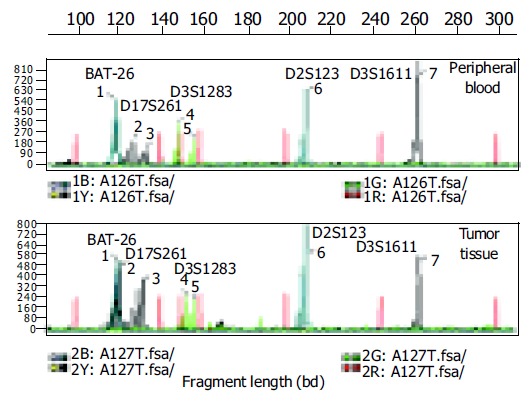
(PDF) Electropherograms of five microsatellite loci in the peripheral blood sample and tumor tissue of one gastric cancer patient. Red peaks: interval standard peaks.

(PDF) Electropherograms of five microsatellite loci in the peripheral blood sample and tumor tissue of one gastric cancer patient. Red peaks: interval standard peaks.