Fig. 1.
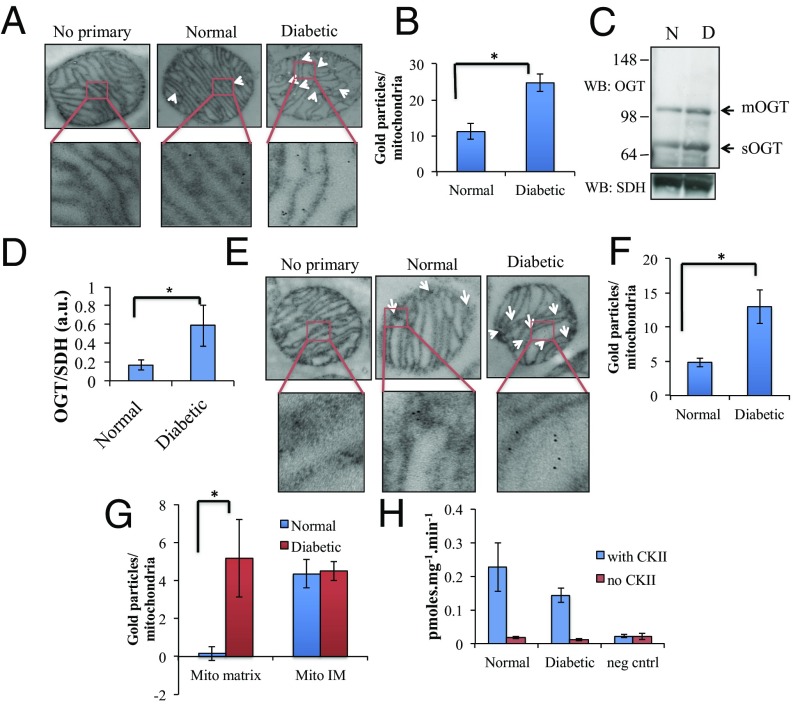
TEM analysis of mitochondrial O-GlcNAc and OGT from normal and diabetic rat hearts. (A) TEM image of rat heart mitochondria labeled with anti–O-GlcNAc antibody, RL2. Control samples were treated with only secondary antibody. (B) Quantification of immunogold labeling in normal and diabetic mitochondria from A above (n = 3). (C) Western blotting of purified mitochondrial lysate obtained from normal and diabetic rat hearts immunoblotted with an anti-OGT and a succinate dehydrogenase (SDH) antibody (N, normal and D, diabetic). (D) Quantification of OGT intensity upon SDH intensity from purified mitochondria lysate (n = 3). (E) TEM image of rat heart mitochondria labeled with anti-OGT antibody. Control samples were treated with only secondary antibody. (F) Quantification of immunogold labeling in normal and diabetic mitochondria from E above (n = 3). (G) Quantification of immunogold labeling on anti–OGT-treated mitochondria at inner membrane (mito IM) and within the matrix (mito matrix) regions of the sample. (H) Total activity of mitochondrial OGT from normal and diabetic samples as assessed by radioactive transferase assay on purified mitochondrial lysate with an external substrate peptide from CKII. (*P < 0.05).

