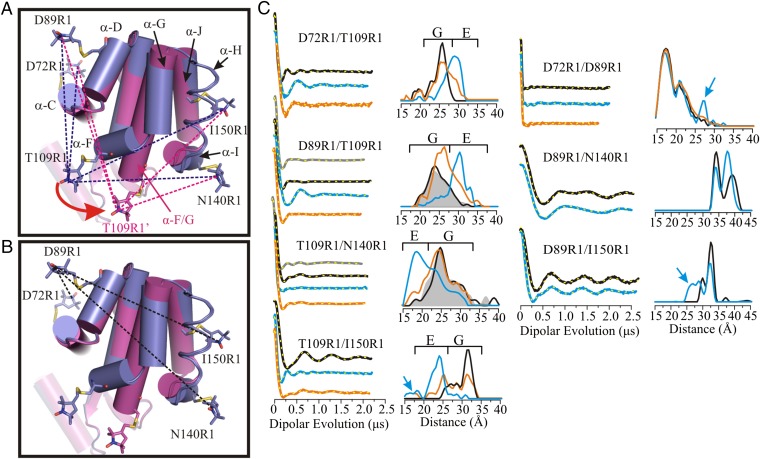
Fig. 1.
Distance mapping of the G and E conformations at atmospheric pressure and pH 5.5 with DEER spectroscopy. (A) An overlay in cylinder representation of the G (PDB ID code 3DMV) and E (PDB ID code 2LC9) (5) conformations of L99A in blue and magenta, respectively. Models of the R1 side chain are shown in stick representation; helix H is rendered in ribbon form to show the 150R1 side chain and its parent helix J. The direction of movement of helix F in the G→E structural transition is indicated by a red arrow. The dashed lines show the distances measured involving residue T109R1 with respect to an R1 reference for the G state (blue) and E state (magenta). (B) Ribbon diagram showing the interspin distances measured between the indicated reference sites in the G and E conformations. (C) DEFs, model-free fits of the DEFs (dashed yellow traces), and corresponding distance distributions for the indicated spin-labeled mutants in the WT* (black), L99A (gray), and L99A/G113A/R119P (blue) backgrounds in buffer consisting of 50 mM phosphate, 25 mM NaCl, and 20% (vol/vol) glycerol at pH 5.5. The DEFs and distance distributions after addition of benzene to mutants in the L99A/G113A/R119P background are shown in orange. The blue arrows identify distances only observed in the E conformation. The range of distances corresponding to the G and E conformations are indicated by brackets above the distributions.

