Fig. 3.
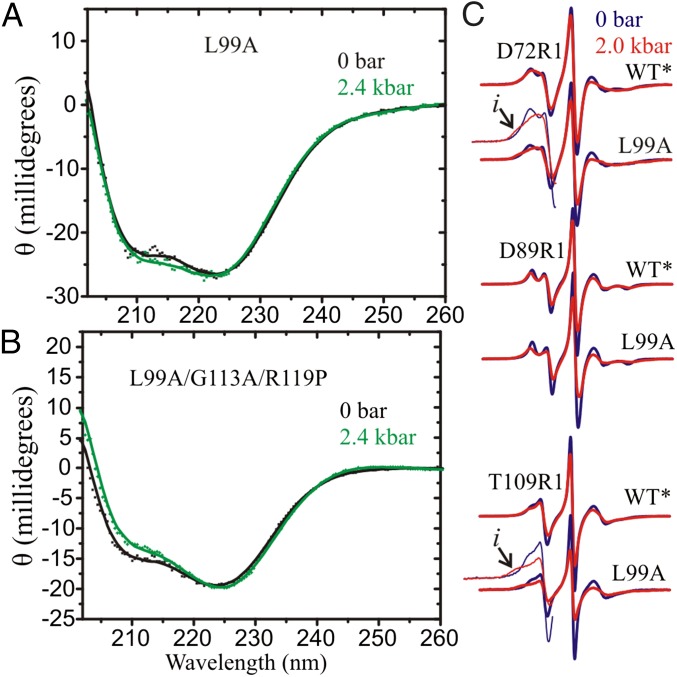
High-pressure CD and CW EPR of T4L mutants. (A) High-pressure far-UV CD of L99A and (B) L99A/G113A/R119P. Both proteins contained spin labels D89R1/T109R1. CD Spectra were recorded in 5 mM MES and 2.5 mM NaCl at pH 5.5 for L99A and 10 mM MES and 25 mM NaCl at pH 6.8 for L99A/G113A/R119P at the indicated pressure. The typical protein concentration was ∼15 μM. (C) CW EPR spectra of the indicated protein at 0 and 2 kbar are shown in blue and red traces, respectively. For clarity, the low field lines in the spectra of D72R1/L99A and T109R1/L99A are amplified. Arrows identify a new component observed at 2 kbar. Spectra were recorded in 25% (wt/wt) Ficoll-70 at pH 5.5.

