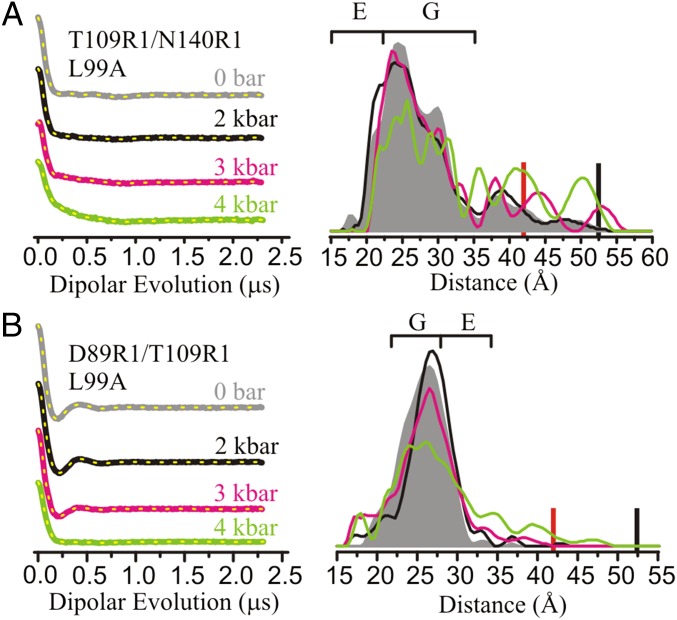
Fig. 4.
Effect of pressure on L99A monitored with DEER using spin pairs (A) T109R1/N140R1 and (B) D89R1/T109R1. DEFs and model-free fits (dashed yellow traces) (Left) and corresponding distance distributions (Right) are shown from 0 to 4 kbar. The DEFs and distance distributions are color-coded as indicated. The approximated distances corresponding to the G and E states are indicated with brackets above the distributions. PR DEER experiments were conducted in buffer consisting of 50 mM MES, 25 mM NaCl, and 20% (vol/vol) glycerol at pH 5.5. The red and black bars indicate the upper limit of reliable shape and distance of the distribution, respectively (Materials and Methods).

