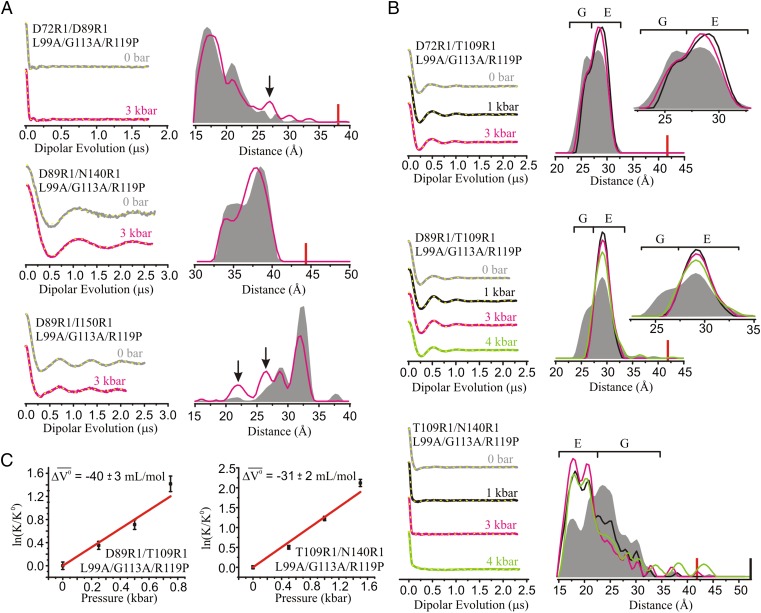
Fig. 5.
The effect of pressure on the G ↔ E equilibrium in L99A/G113A/R119P. PR DEER was used to map distance changes (A) between indicated reference sites and (B) between T109R1 and selected references to monitor the position of helix F. DEFs, model-free fits of the DEFs (dashed yellow traces), and corresponding distance distributions are shown at various pressures between 0 and 4 kbar. DEFs and distance distributions are color-coded as indicated. The black arrows identify populations in reference pairs increased by pressure. The approximate distance ranges corresponding to G and E are indicated by brackets above the distributions. PR DEER data were collected for the protein in buffer consisting of 50 mM MOPS, 25 mM NaCl, and 20% (vol/vol) glycerol at pH 6.8. The red and black bars indicate the upper limit of reliable shape and distance of the distribution, respectively (Materials and Methods). (C) Plots of ln(K/Ko) vs. pressure for the indicated mutants, and fits (red trace) using a two-state model to measure Δ for the G → E transition.

