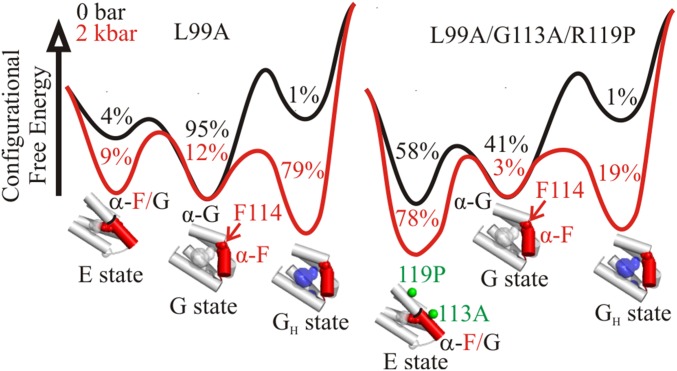
Fig. 6.
Effect of pressure on the equilibrium between the GH, G, and E states of T4L mutants L99A (Left) and L99A/G113A/R119P (Right). Relative configurational free energies (ΔGo) are shown for 0 and 2 kbar; values for the GH and E states are relative to G. Values for Δ and ΔGo are −36 mL/mol and −0.2 kcal/mol, respectively, for the G-to-E transition (based on PR DEER of L99A/G113A/R119P), and −75 mL/mol and 2.5 kcal/mol, respectively, for the G-to-GH transition [based on high-pressure tryptophan fluorescence of L99A (14) and the total L99A cavity volume]. Populations of each state are indicated in the local minima of the landscape. Structural models for the C domain are shown below the corresponding energy minima. Helix F is shown in red. The location of Phe114 (red spheres) in the G and E states are indicated. The empty cavity is shown in gray surface representation. A blue surface is used to represent pressure-populated hydration of the cavity in the L99A mutant. Green spheres at the Cα are used to indicate the position of G113A and R119P mutants in the E state structure (PDB ID code 2LC9) (5).

