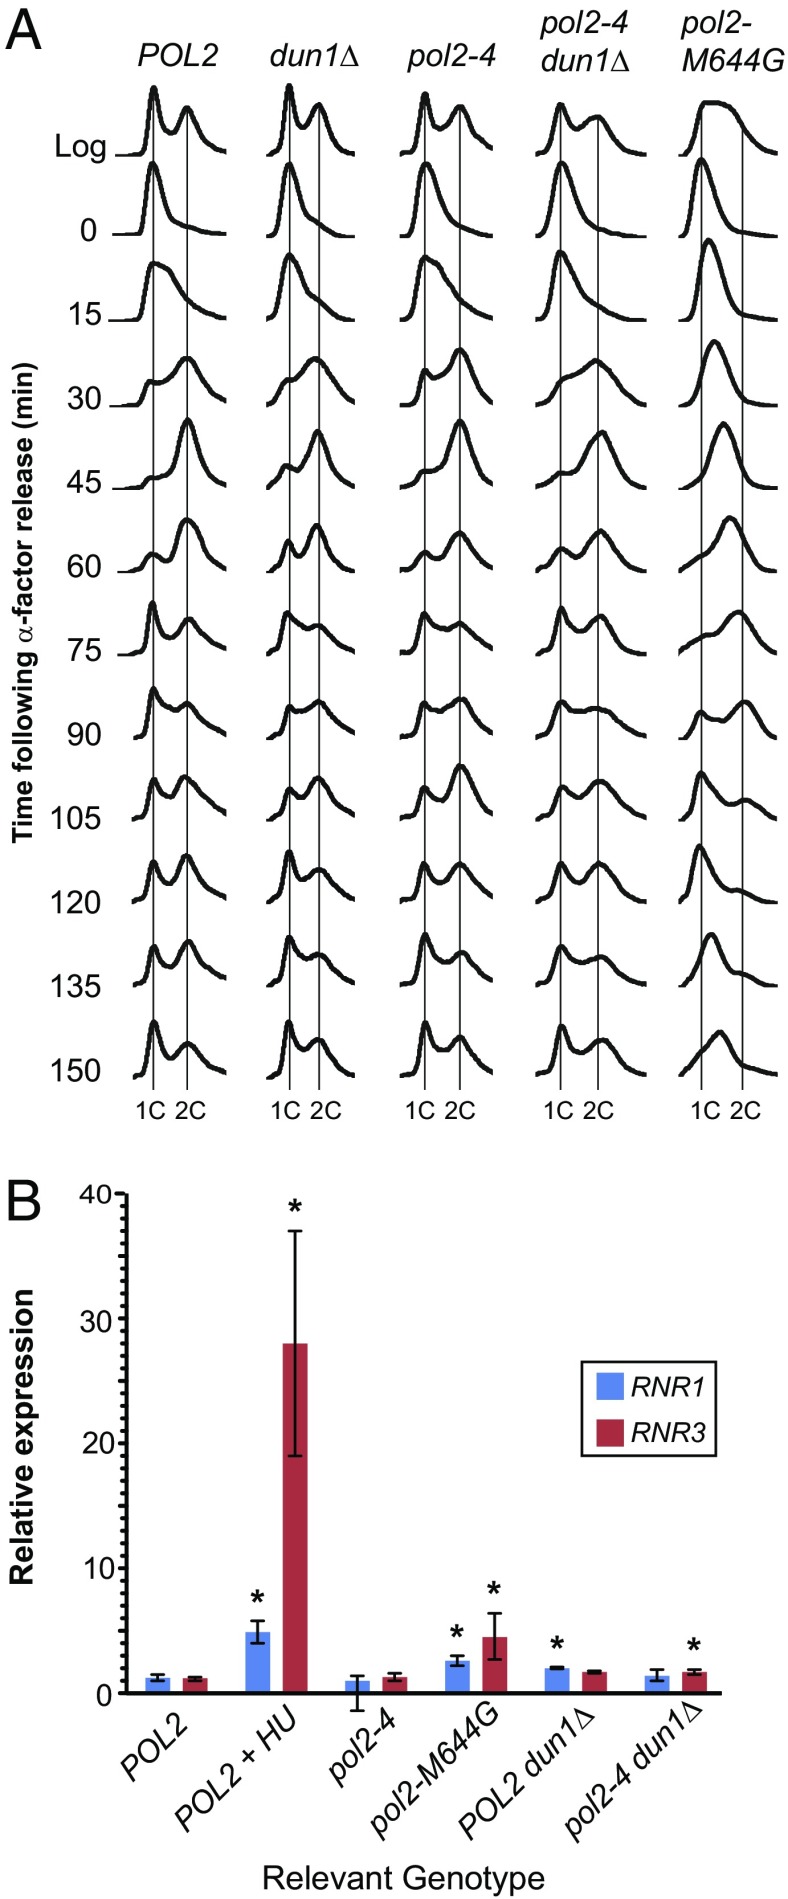
Fig. 3.
Cell cycle progression and RNR transcript expression in pol2-4 and pol2-M644G strains. (A) Cell cycle progression of pol2 mutator strains. Cells were synchronized with α-factor, released into rich medium, and monitored for DNA content by FACS. The x axis represents relative DNA content, and the y axis represents cell number at the indicated time points. Vertical lines indicate ploidy (1C and 2C). (B) Checkpoint induction in pol2 mutator strains. Transcript levels of RNR1 and RNR3 were measured by quantitative PCR assay, normalized to actin expression, and then normalized to the levels found in POL2 control cells. RNA isolated from POL2 cells treated with 200 mM hydroxyurea for 2 h was used as a positive control for checkpoint activation. Error bars show 95% confidence intervals for transcript expression based on three independent biological replicas. Asterisks denote expression levels that are significantly different (P ≤ 0.05) from POL2 control cells.

