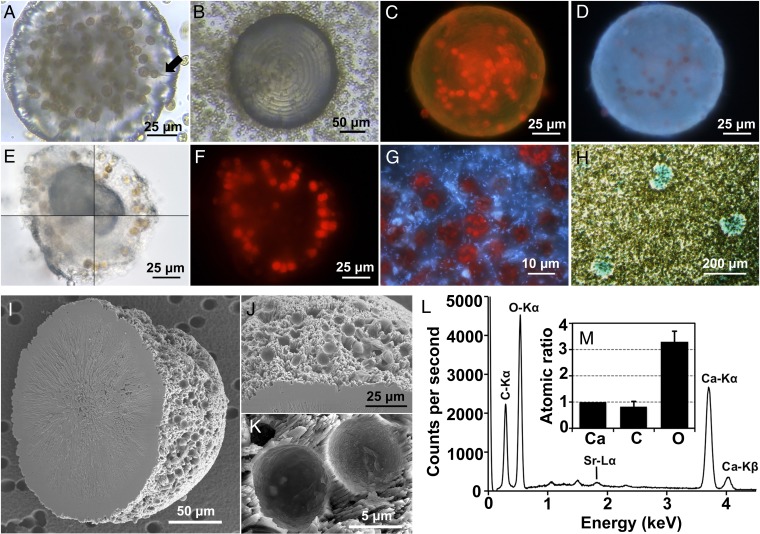
Fig. 1.
Morphology, biota, ultrastructure, and elemental composition of symbiolites. (A) Symbiolite in Symbiodinium culture 362. The arrow highlights one of the ducts observed in focal plane (see also Movie S1). (B) Symbiolite in culture 24 with well-defined growth rings. (C) Red chlorophyll fluorescence of embedded Symbiodinium cells and green symbiolite fluorescence under blue-light (450–490 nm) excitation. (D) Blue fluorescence of symbiolites when excited with UV light (330–380 nm). (E) Acid digestion of a symbiolite in 30-s steps, clockwise from upper left. (F) The symbiolite in E after acid digestion. Chlorophyll fluorescence demonstrates how the Symbiodinium cells are held in place by the remaining matrix. (G) Blue fluorescence of bacteria after acid digestion and DAPI staining (culture 203). (H) Positive staining of symbiolite-associated EPS with Alcian blue. (I–M) SEM micrographs of a symbiolite without biota and EPS. (I) Symbiolite showing the overall hemispherical shape and the round depressions left by the removed algal cells. (J and K) Detailed views of features shown in I. (L and M) Elemental composition of the symbiolite mineral phase as determined by EDS. (L) Annotated energy dispersion spectra. (M) Atomic ratios of calcium (Ca), carbon (C), and oxygen (O) based on their K-series spectra (n = 3).

