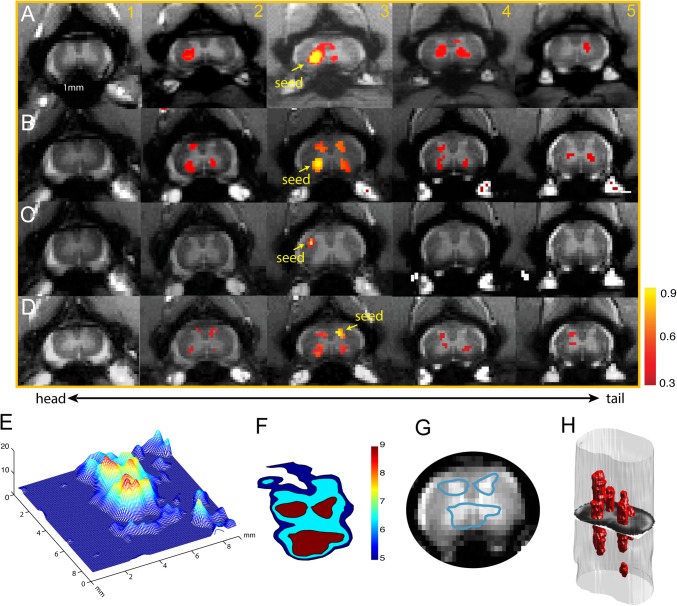
Fig. 2.
Reproducible functional connectivity pattern of the spinal cord horns. (A and B) Intra- (within) and inter- (across) slice correlation patterns of the seeds (indicated by yellow arrows) placed at the ventral horns on slice 3 in two representative normal animals (A, SM-H; B, SM-R). Correlation maps were thresholded at r > 0.30 (see color scale bar next to image 5). (C) Intra- and interslice correlation pattern of one control seed at the white matter of slice 3 in SM-H. (D) Intra- and interslice correlation patterns of the seed (indicated by yellow arrows) placed at the LDH on slice 3. Correlation maps were thresholded at r > 0.30 (see color scale bar next to image 5). (E) A 3D illustration of the t statistic of the correlation map of the RVH at the group level (15 runs from 5 animals). (F) Corresponding contour map of the group correlation pattern at three different t statistics (blue, t = 5; light blue, t = 6.5; red, t = 9). The LVH in slice 3 in one subject was used as the point of interest for manual coregistration in the group analysis. (G) Overlay of the thresholded (red patch) correlation map of LVH seed on the mean intensity map of the spinal cord MTC images. (H) A 3D reconstruction of the correlation map from the sample case shown in A.

