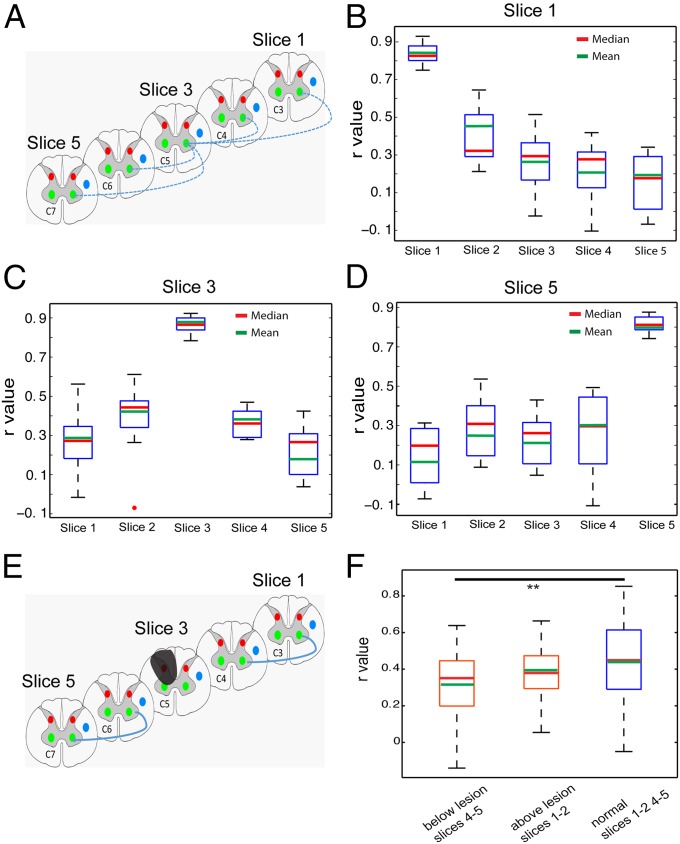
Fig. 4.
Functional connectivity pattern of interslice ROIs in normal and lesion conditions. (A) Schematic diagram shows the pair-wise correlation analysis (indicated by blue lines) with respect to one particular seed ROI of the LVH of slice 3 (∼ at C5 level). Correlation coefficients (r values) were calculated between the LVH on slice 3 (seed) with respect to the corresponding LVH on slices 1, 2, 4, and 5. (B) Whisker box plots of the correlation coefficient of the LVH ROI (on image slice 1) with other ventral horn seeds on slices 1–5 in the group analysis. (C and D) Whisker box plots of the correlation coefficients of the LVH seeds on the third (C) and fifth (D) slices with other ventral horn seeds. The upper and lower bounds of the box indicate the upper and lower quartile of the group data (15 datasets from 5 animals). The red and green lines indicate the mean and median values, respectively. (E) Schematic diagram shows the calculation scheme for comparing correlation values between interslice ROIs in lesion condition. Only correlations between corresponding horns (left ventral to left ventral) are included in the quantification. (F) Whisker box plots of r values in three different ROI pair groups: below lesion slices (between slices 4 and5), above lesion slices (between slices 1 and 2), and normal condition (between slices 1 and 2 and 4 and 5). **P < 0.0001 in Mann–Whitney Wilcoxon test.

