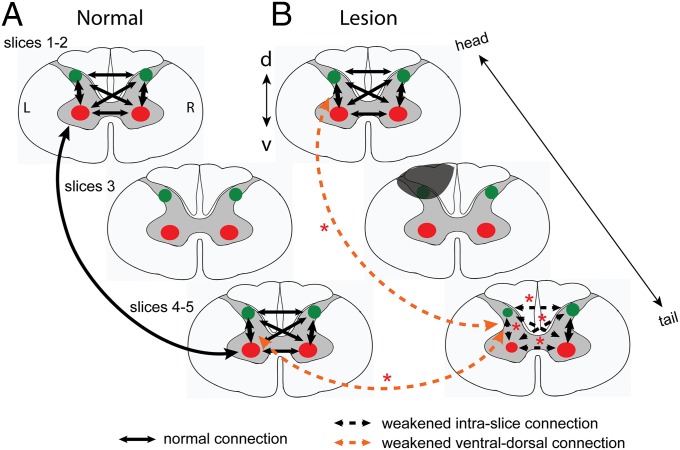
Fig. 5.
Schematic illustration of the changes of functional connectivity between intra- and interslice ROIs after unilateral dorsal column lesion. (A) Functional connectivity patterns among horns within (intraslice) and across (interslice) imaging slices. The thickness (3 mm) of each slice approximately equals to the thickness of the single spinal cord segment. Green dots, dorsal horns; red dots, ventral horns. Black arrows indicate the functional connections, with thicker lines (ventral to dorsal) showing stronger connectivity. L, left side (lesion side); R, right side. (B) Altered functional connection patterns after unilateral lesion of the spinal cord gray and white matters. Gray shadow indicates the lesion. Dotted arrow lines indicate the weakened functional connectivity between different pairs of ROIs. Red asterisks represent the statistical significance level of the changes. Experimental results supporting the weakened ventral–dorsal horn connections (orange dotted lines) are presented in Fig. S2. *P < 0.01. d, dorsal; v, ventral. L, left; R, right.

