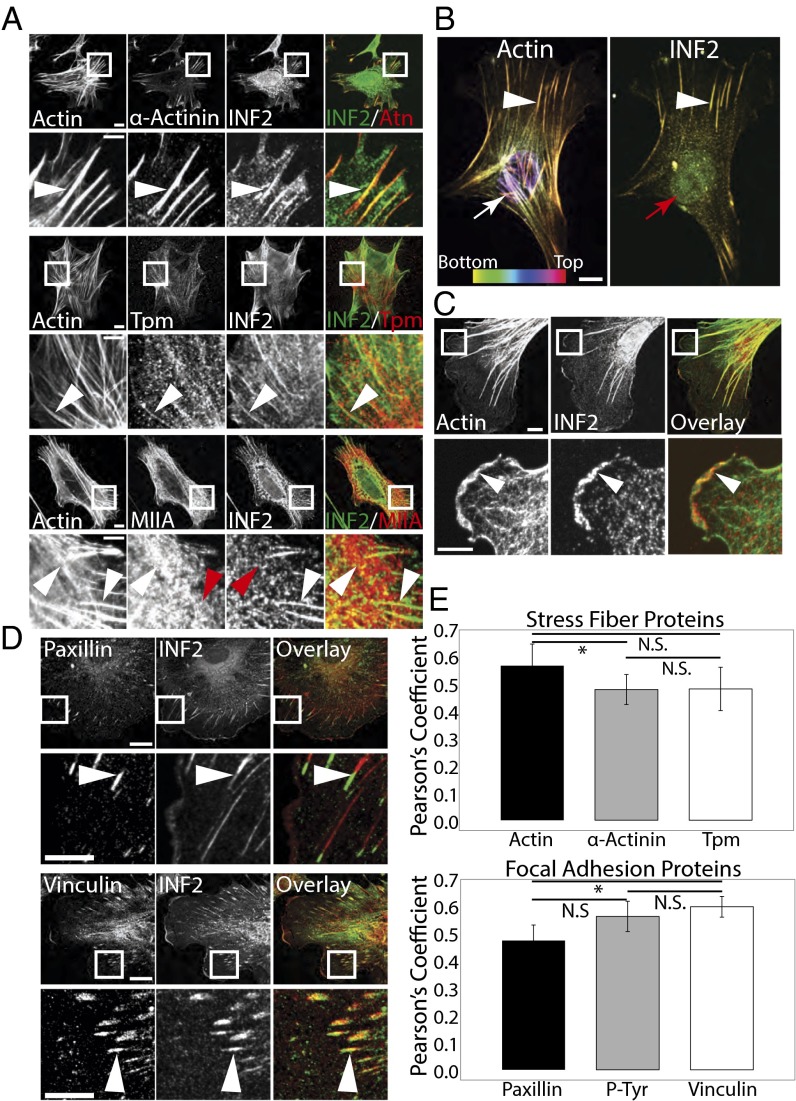
Fig. 1.
Formin INF2 localizes to dorsal SFs at the junction with FAs. (A) Representative confocal micrographs of INF2 immunofluorescence (color-coded green) with Alexa-488 phalloidin staining of actin and immunofluorescence of the actin binding proteins α-actinin (Top, color-coded red), pan-tropomyosin (Middle, red) and myosin IIA (Bottom, red) in acetone-fixed MEFs. White boxes indicate area zoomed below. White arrowheads indicate colocalization at actin structures. Red arrowheads indicate lack of colocalization. [Scale bar, (Top) 10 µm; (Bottom) 5 µm.] (B) Maximal projection of confocal Z series of Alexa-488 phalloidin staining of actin (Left) and immunofluorescence of INF2 (Right). Color scale of z position is shown at the Lower Left. White arrowheads indicate colocalization along dorsal SFs. Arrows indicate dorsal actin structures (white) that lack INF2 (red). (Scale bar, 10 µm.) (C) Representative confocal micrographs of Alexa-488 phalloidin staining of actin (green) with INF2 (red) immunofluorescence with overlay shown. White boxes indicate area zoomed below. White arrowhead indicates colocalization of actin and INF2 at cell edge. [Scale bar, (Top) 10 µm; (Bottom) 5 µm.] (D) Representative confocal micrographs of INF2 immunofluorescence (green) and immunofluorescence of the focal FA proteins paxillin (Top, red) and vinculin (Bottom, red). White boxes indicate area zoomed below. White arrowheads indicate colocalization at FAs. [Scale bar, (Top) 10 µm; (Bottom) 5 µm.] (E) Bar graph of Pearson’s coefficient of colocalization between INF2 and SF proteins (Top) or FA proteins (Bottom). n = 6 cells per condition. Error bars: SD. *P < 0.05; N.S., not significant, Student’s t test.

