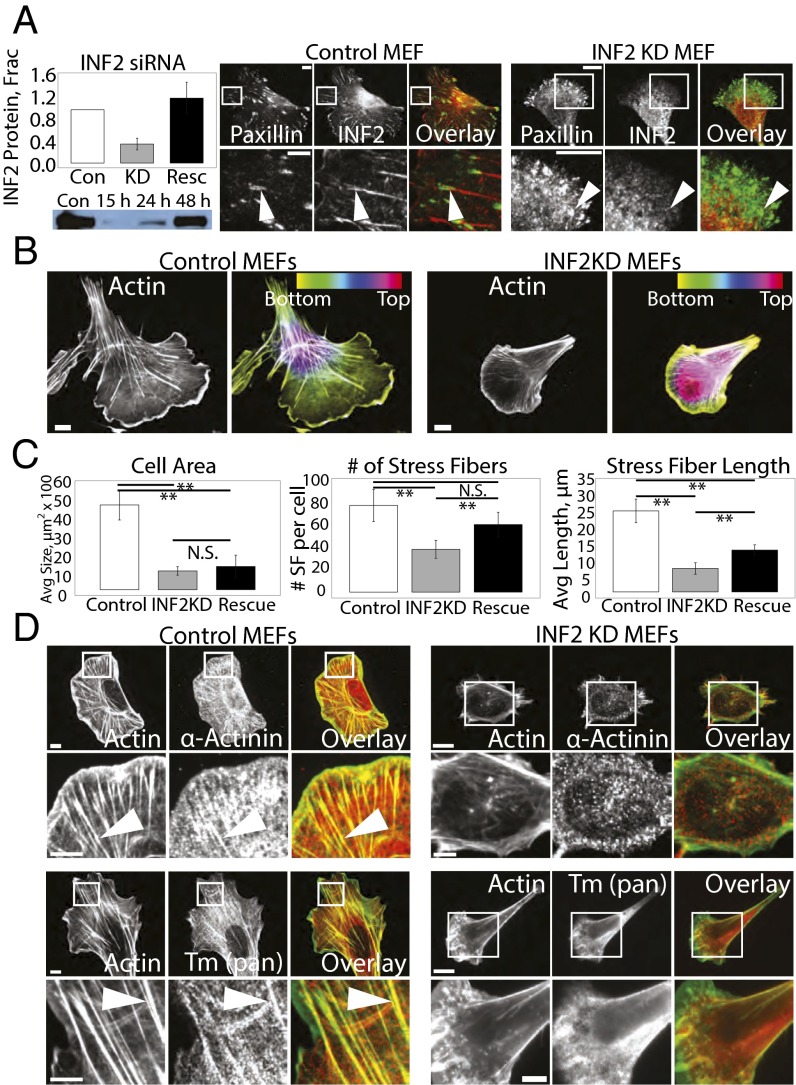
Fig. 2.
INF2 controls SF morphology and lamellipodial width. (A, Left Top) Bar graph of the average level of depletion and reexpression of INF2 in four independent experiments. Error bar: SD. (Bottom) Representative image of Western blot showing levels of INF2 in mock-transfected control (Con) and MEF transfected with siRNA targeting INF2 (INF2 KD) for 15, 24, and 48 h. (Right) Representative confocal micrographs of Alexa-488 phalloidin staining of actin with immunofluorescence of INF2 in control and INF2 KD MEF showing loss of INF2 at FA in INF2 KD. White boxes indicate area zoomed below. [Scale bar, (Top) 10 µm; (Bottom) 5 µm.] Note the difference in size of the scale bar in control and INF2 KD cells. (B) Black and white images: Representative confocal micrographs of Alexa-488 phalloidin staining of actin in control and MEFs transfected with siRNAs targeting INF2 (INF2 KD). Color images: Maximal projection of confocal Z series of Alexa-488 phalloidin staining of actin in control and INF2 KD MEFs. Color scale of z position is shown at Upper Right. (Scale bar, 10 µm.) (C) Bar graphs of the average cell area (Left), the number of SFs per cell (Center), and length of SFs (Right) in control MEFs, INF2 KD MEFs, or INF2 KD MEFs reexpressing the human INF2 isoform lacking the mitochondrial targeting sequence fused to GFP (rescue) n = 20 cells per condition. Error bar: SD. **P < 0.01, N.S., not significant, Student’s t test. (D) Representative confocal micrographs of Alexa-488 phalloidin (green) staining of actin with immunofluorescence of the actin-binding proteins α-actinin (Top, red) and pan-tropomyosin (Bottom, red) in control and INF2 KD MEFs. White boxes indicate area zoomed below. White arrowheads indicate linear actin bundles. [Scale bar, (Top) 10 µm; (Bottom) 5 µm.]

