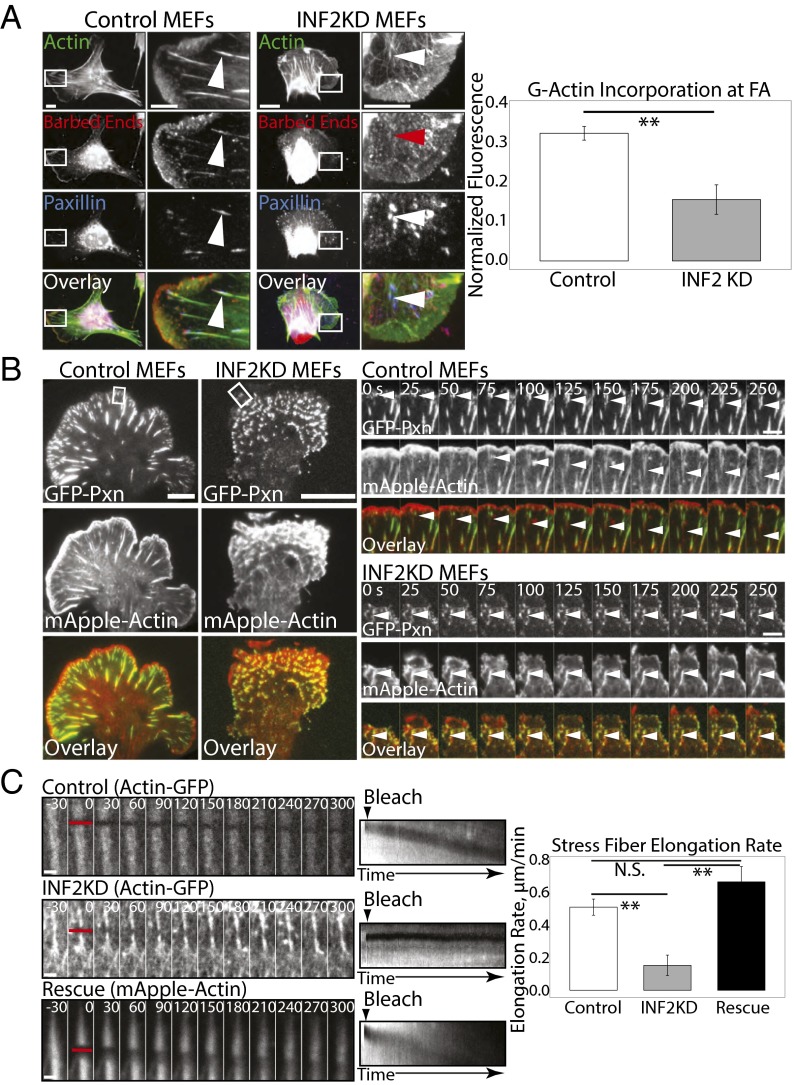
Fig. 3.
INF2 mediates barbed end formation and actin assembly at FAs. (A, Left) Representative confocal micrographs of permeabilized mock-transfected control and MEFs transfected with siRNAs targeting INF2 (INF2 KD) showing Alexa-488 phalloidin (green) staining of F-actin together with X-rhodamine labeled G-actin (red) incorporation (barbed ends) and immunofluorescence of paxillin (blue) with color overlay shown. White boxes indicate area zoomed below. White arrowheads indicate presence of G-actin incorporation at FAs. Red arrowhead indicates reduced incorporation. [Scale bar, (Left) 10 µm; (Right) 5 µm.] Note the difference in size of the scale bar in control and INF2 KD cells. (Right) Bar graph of G-actin incorporation at FAs as measured by the ratio of X-rhodamine G-actin fluorescence to Alexa-488 phalloidin fluorescence at FAs. n = 5 cells, at least 250 FAs per condition. Error bar: SD. *P < 0.05; N.S., not significant, Student’s t test. (B, Left) Representative TIRF micrographs of control and INF2 KD MEF expressing EGFP-paxillin (Top, green) and mApple-actin (Center, red). Color overlay is shown at Bottom. White boxes indicated area zoomed at Right. (Scale bar, 10 µm.) Right: TIRF time lapse image sequences of an actin bundle (Center, red) elongating out of a paxillin-marked FA (Top, green) with color overlay shown (Bottom). Time in seconds is shown. White arrowheads indicate a single FA and associated actin. (Scale bar, 2 µm.) (C, Left) Representative confocal time lapse image sequence of EGFP-actin SF in mock-transfected or INF2 KD MEF, or mApple-actin SF in INF2 KD cells reexpressing the human INF2-GFP isoform lacking the mitochondrial targeting sequence (rescue). Red bar indicates area photobleached at time 0. Time in seconds is shown. (Scale bar, 1 µm.) (Center) Kymograph projection of rearward movement/recovery of bleached region. Arrowhead indicates time of bleach. (Right) Bar graph of average SF elongation rate in mock transfected, INF2 KD, or INF2-GFP rescue. n = 10 SFs per condition. Error bar: SD. **P < 0.01, Student’s t test.

