Fig. 5.
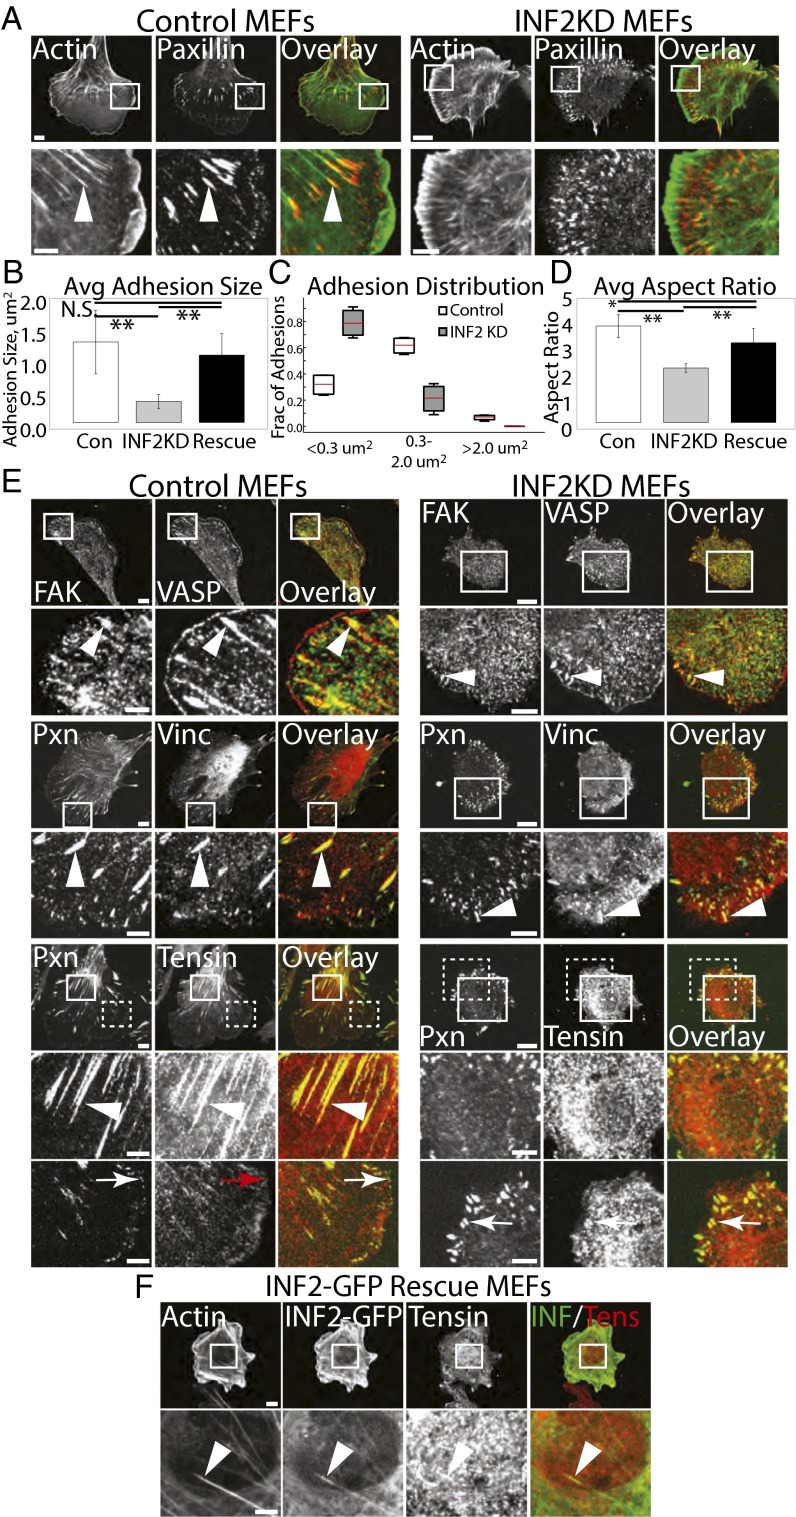
INF2 is critical for morphological maturation of FAs. (A) Representative confocal micrographs of mock-transfected control MEF and MEF transfected with siRNAs targeting INF2 (INF2 KD) showing Alexa-488 phalloidin staining of actin (green) with immunofluorescence of paxillin (red). White boxes indicate area zoomed below. White arrowheads show termination of SF at FA. [Scale bar, (Top) 10 µm; (Bottom) 5 µm.] Note the difference in size of the scale bar in control and INF2 KD cells. (B–D) Quantification of FA morphometry from analysis of fluorescence images of paxillin in control, INF2 KD, and INF2 KD cells reexpressing the human INF2-GFP isoform lacking the mitochondrial targeting sequence (rescue). n = 15 cells, at least 900 FAs per condition. (B and D) Bar graphs of FA area (B) and aspect ratio (D). Error bars: SD. **P < 0.01; *P < 0.05; N.S., not significant, Student’s t test. (C) Box and whisker plot of FA size distribution, means are indicated by red bars. (E) Representative confocal micrographs of immunofluorescence of paxillin (Pxn) or VASP (both green) with FA proteins found at nascent (FAK, Top, red), maturing [vinculin (Vinc), Middle, red] and fibrillar (tensin, Bottom, red) FAs in control (Left) and INF2 KD (Right) MEFs. White boxes indicate areas zoomed below; white dashed boxes indicate area zoomed on bottom row. White arrows indicate nascent FA, arrowheads denote mature FA, red arrow indicates lack of colocalization of tensin with paxillin in nascent FA. [Scale bar, (Top) 10 µm; (Bottom Left) 5 µm.] (F) Immunofluorescence of tensin and INF2-GFP in INF2-GFP re-expressing MEF. White boxes indicate areas zoomed below. Arrowheads denote colocalization of tensin and INF2 at central adhesion. [Scale bar, (Top) 10 µm; (Bottom) 5 µm.]

