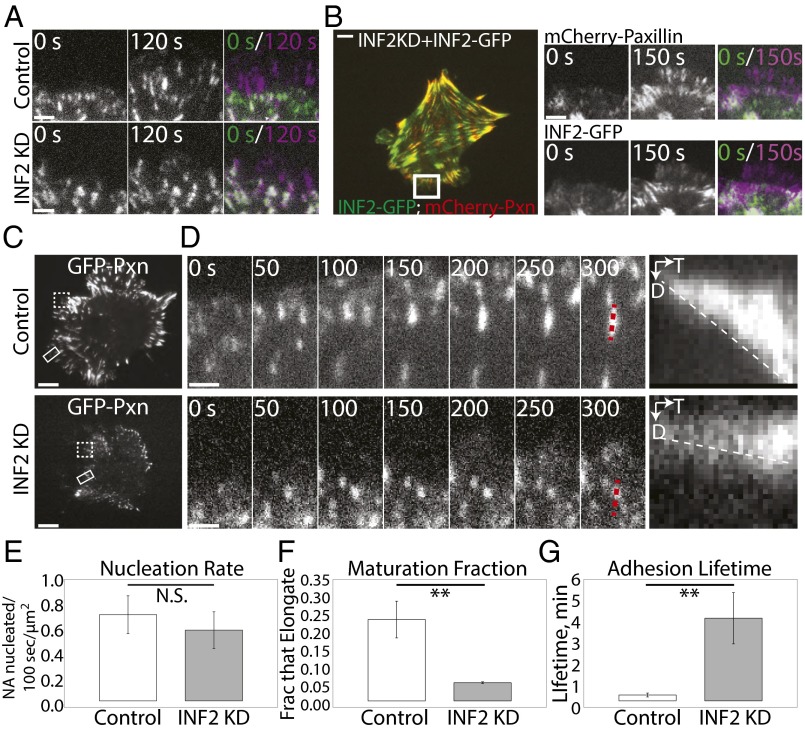
Fig. 6.
INF2 promotes centripetal elongation and turnover of nascent FAs. (A) TIRF micrographs from time-lapse image series of the cell edge in mock-transfected control and MEF transfected with siRNAs targeting INF2 (INF2 KD) expressing EGFP-paxillin. The color overlay shows the two time points 120 s apart; purple FAs were assembled in the time gap, green FAs disassembled during the time gap, and white FAs remained present throughout the 120-time gap. (Scale bar, 2 µm.) (B, Left) Representative TIRF micrograph of INF2 KD cells reexpressing the human INF2-GFP isoform lacking the mitochondrial targeting sequence (INF2-GFP, green) and mCherry-paxillin (red). (Right) TIRF micrographs from time-lapse image series of the cell edge in control and INF2 KD MEFs expressing INF2-GFP. The overlay shows the two time points differentially color encoded [t = 0 s (green) and t = 150 s (purple)]. (Scale bar, 5 µm.) (C) Representative TIRF micrographs of control and INF2 KD MEF transfected with EGFP-paxillin. White rectangle highlights the region shown in time-lapse sequence in D. Dashed white box highlights the region shown in overlay in A. (Scale bar, 10 µm.) (D) TIRF time-lapse micrographs of FA dynamics in control and INF2 KD MEF; FA marker EGFP-paxillin; time in seconds is shown. Dashed red line indicates lines along FA used for kymograph analyses (Right) of FA growth. D, distance; T, time. (Scale bar, 1 µm.) Dashed white line highlights the slope, indicative of the rate of FA growth. (E–G) Bar graphs of nascent FA formation rate per micrometer of cell edge (nucleation rate, E), the fraction of nascent FAs that undergo maturation (maturation fraction, F), and average FA lifetime (G), in control and INF2 KD MEF. FA marker, paxillin. n = 5 cells, at least 200 adhesions per condition. Error bar: SD. **P < 0.01; N.S., not significant, Student’s t test.

