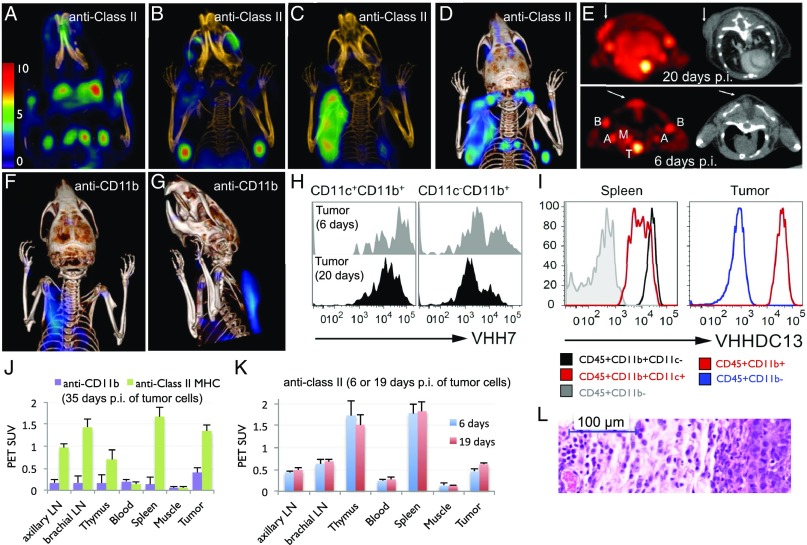
Fig. 3.
18F-VHH7 (anti-mouse class II MHC) and 18F-VHHDC13 (anti-mouse CD11b) detects inflammation. Tumor-associated class II MHC+ cells were visualized using 18F-VHH7. A NOD-SCID mouse was inoculated subcutaneously on the back of the left shoulder with 5 × 10⁶ human Mel-Juso melanoma cells and imaged 35 days postinjection. (A–C) Coronal PET-CT images, moving from anterior to posterior. In A and B, different sets of lymph nodes are visible. In C, tumor-associated class II MHC+ cells are visible, attributable to influx of host-derived class II MHC+ cells. (D) PET-CT as maximum intensity projections of all slices. See Movie S3 for a 3D visualization of lymph nodes and tumor-associated class II MHC+ cells. (E) 18F-VHH7 detects class II MHC+ cells associated with small tumors at early stages. NOD-SCID mice were inoculated with Mel-Juso cells as in A, 20 d (Upper) and 6 d (Lower) prior to imaging. Transverse PET and CT images (Left and Right, respectively) are shown for better visualization of the class II MHC+ cells at the site of cancer cells. Images are all window-leveled to the same intensity. Tumors and associated class II MHC+ cells are highlighted with arrows. Axillary (label A), brachial (label B), and mediastinal (label M) lymph nodes and thymus (label T) are shown in E, Lower. (F and G) A NOD-SCID mouse was inoculated subcutaneously on the back of the left shoulder with 5 × 10⁶ human Mel-Juso melanoma cells and imaged 35 days postinjection with 18F-VHHDC13. Tumor-associated CD11b+ cells are visible, attributable to influx of host-derived CD11b+ cells. See Movie S4 for a 3D visualization. (H and I) FACS analysis of tumor-infiltrating immune cells. The next day, tumors were excised and digested with collagenase D, and tumor-infiltrating cells were obtained after Percoll gradient. Cell suspensions were then stained for FACS analysis. (H) Histograms show the FACS staining of mouse CD45+ tumor-infiltrating cells with VHH7-Alexa 647. Histograms on the Left are gated on CD11c+CD11b+ cells (dendritic cells), and histograms on the Right are gated on CD11c−CD11b+cells (macrophages and other myeloid cells) for the indicated time points. (I) Tumor-infiltrating cells were harvested 35 d after tumor inoculation as in H and stained with VHHDC13-Alexa 647. Histograms show the levels of CD11b as measured by VHHDC13 on the indicated cell populations. Spleen from the same mouse is shown for comparison. Histograms are representative of two to four mice with similar results. (J) PET signals in vivo for the indicated experiment in D and F. (K) PET signals in vivo for the indicated experiment in E. (L) Hematoxylin/eosin (H&E) stains of the tumor from the mice in the part D (human melanoma tumor in NOD-SCID mouse; 35 d postinjection of the cells).

