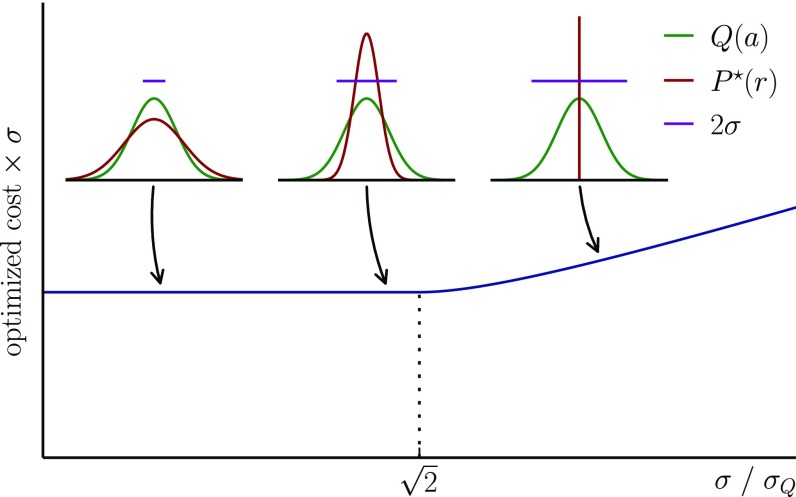
Fig. 2.
The optimal cost and receptor distributions for protecting against a one-dimensional Gaussian antigenic landscape of variance , as a function of the cross-reactivity width σ. As σ increases, the optimal distribution becomes narrower and narrower (Left and Center Insets), until it concentrates entirely onto a single point, for (Right Inset). The minimal cost (multiplied by σ for a comparison at constant recognition capability) is constant below the transition point, but increases with σ past it. The cross-reactivity function, which quantifies the affinity between receptor r and antigen a as a function of their distance in shape space, has a Gaussian form, , and the cost function is linear in the effective recognition time, .

