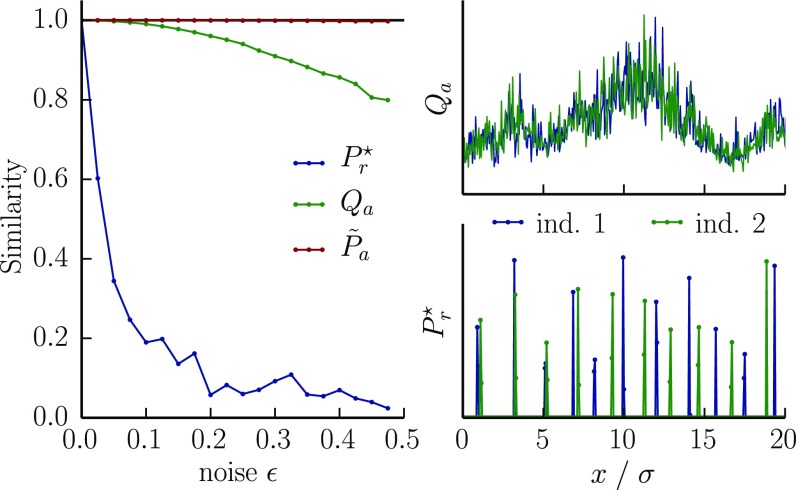
Fig. 4.
Two individuals in the same environment that see it with slightly different noises have similar coverages of the antigenic space, but achieve it with different receptors. This results in largely nonoverlapping repertoires. Shown are the overlaps (normalized to be between 0 and 1) between the experienced pathogen distributions , the resulting optimal receptor distributions , and the corresponding coverages , as a function of the noise ε with which individuals perceive the environment. Right plots show an example of antigenic environments and optimal receptor distributions for . We calculated the optimal receptor distributions for two individuals 1 and 2 experiencing respective environments and , where Q is a random environment with fluctuations on scales larger than the cross-reactivity σ [power spectrum ] normalized so that its coefficient of variation is 0.5, and , are Gaussian noises of mean zero and variance . The choice of cost and cross-reactivity functions are the same as in Fig. 2.

