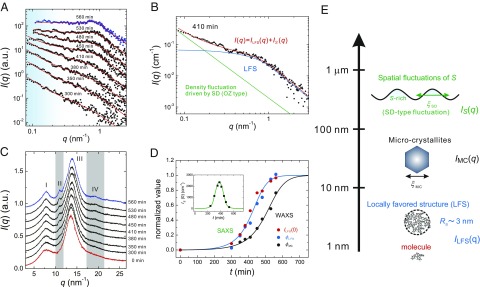
Fig. 1.
Structural evolution during LLT. (A) Time evolution of in a small-angle regime during LLT at 212 K. The blue and black filled circles correspond to of liquid II after the transformation (at 560 min) and in the transformation process, respectively. Here the contribution from wide-angle scattering [the tail of the peak at 7.7 (see C)] is already subtracted from the original data. The red solid curves represent the best fits by Eqs. 1–3. The light blue regime shows the contribution from large-scale density fluctuations associated with SD-type LLT. (B) An example of the fitting at 410 min. The total scattering function (red solid line) is decomposed into the contribution of LFS (blue solid line) and that of large-scale density fluctuations (green solid line). (C) Time evolution of in a wide-angle regime. The red and blue curves correspond to at 0 min and 560 min, respectively, and black curves to in the transformation process. Here we label the peaks of as I, II, III, and IV from a lower to higher wavenumber. Peaks II and IV highlighted by the gray belts appear and grow during LLT. (D) Time evolutions of the normalized (blue filled circles), (red filled circles), and (black filled circle). The data are fitted by a theoretical prediction for the development of a nonconserved order parameter (60). The blue solid line represents the best fit to both and and the black solid line is the best fit to . (Inset) Temporal change of . The green line is a guide to the eye. Note that the data in A and C are vertically shifted for clarity. (E) Schematic figure representing the hierarchical structure of a liquid state of TPP.

