Fig. 3.
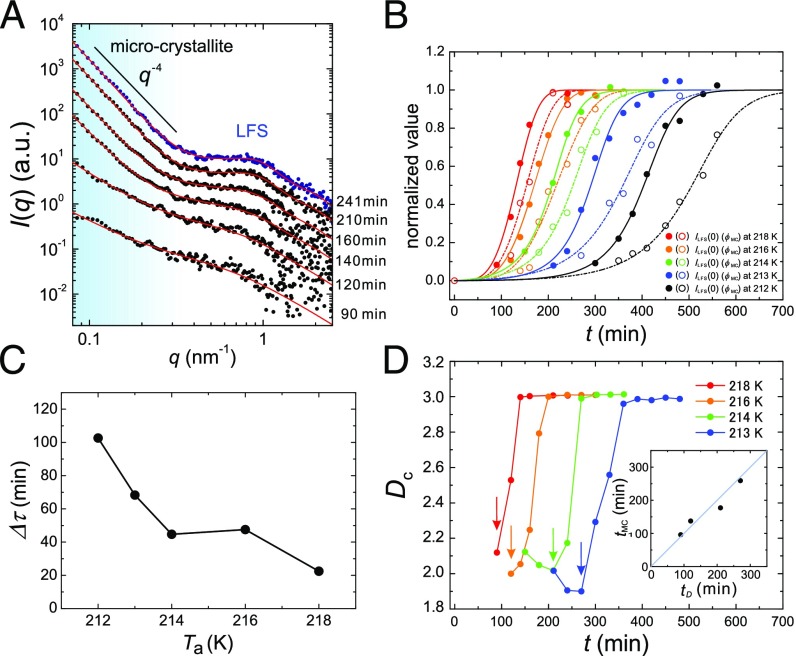
Structural evolution during LLT at various s. (A) Time evolution of in a small-angle regime during LLT at =218 K. The data are vertically shifted for clarity. The blue filled circles show of liquid II at 241 min. The contribution from the wide-angle scattering is subtracted from the data as in Fig. 1A. The red solid curves represent the best fit of the relation with Eqs. 6 and 7. The shoulder around 1 is the scattering contribution from LFS. The scattering signal in the light blue region is mainly from long-range density fluctuations associated with LLT in the early stage, and from microcrystallites in the late stage. (B) Time evolutions of the normalized and for various s. For 212, 213, and 214 K, we used an equation describing SD-type ordering as the fitting function (20). For 216 and 218 K, where NG-type LLT proceeds, we used a Kolmogolov–Avrami equation to describe the evolution (20). The solid curves indicate the best fit to whereas the dash–dot curves correspond to . (C) dependence of the delay time, . See text for the definition of and . (D) dependence of the temporal change of . Each arrow indicates the onset of the change in , i.e., the onset of microcrystal formation. (Inset) Relation between the onset time of , , and that of , , indicating the relation .

