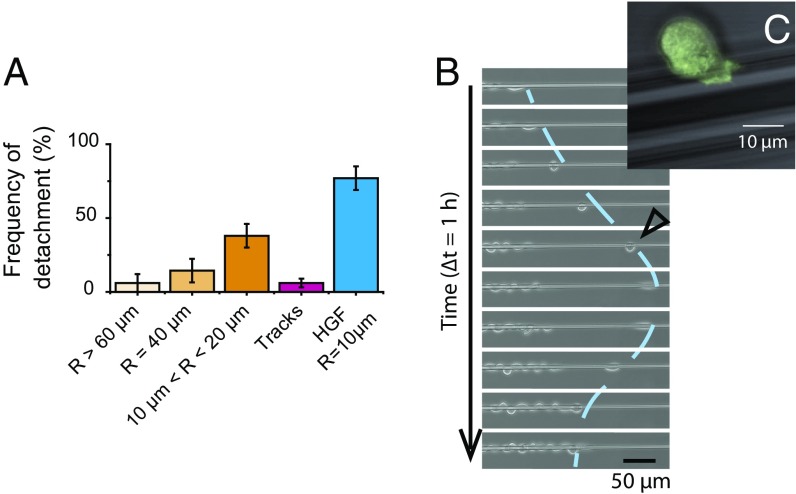
Fig. 2.
(A) Frequencies of detachment of a cell at the front edge. The “frequency of detachment” is the proportion of experiments for which detachment was observed in 22 h. Track measurements were concatenated for 50 µm < w < 200 µm. Measurements in presence of HGF were conducted on 10-µm wires. Error bars are SDs (n > 17 for each box). (B) Sequence illustrating the detachment of a cell at the front edge. Note the change of direction and the reintegration of this cell in the epithelium. R = 5.3 µm. The line is a guide for the eye. (C) Close-up of a detached cell in its fastest migration mode (similar to the cell marked with an empty triangle on B). Note the rounded shape. Superimposition of phase contrast and fluorescence images (LifeAct cells). R = 10 µm.

