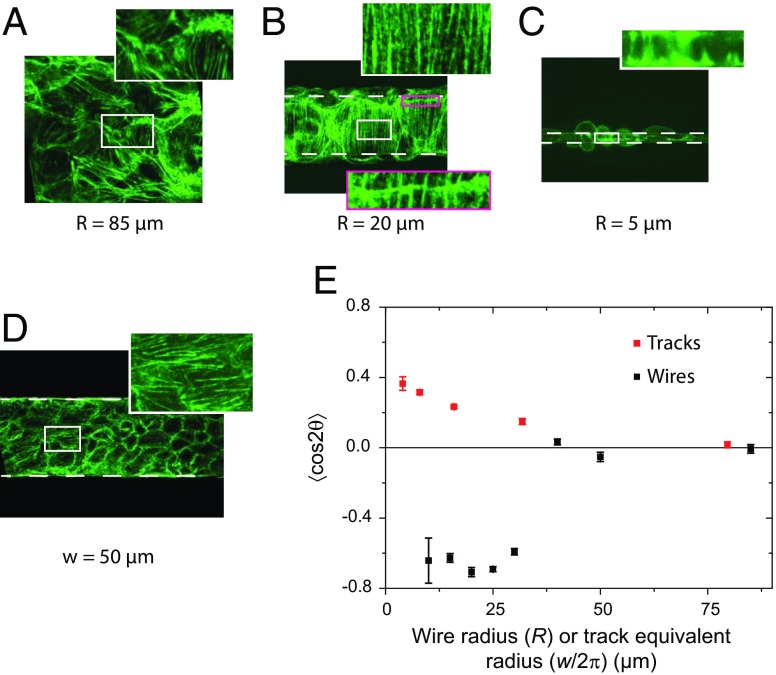
Fig. 3.
(A−C) Orientation of the actin stress fibers for wires of various radii. On the 85-µm wire, the actin fibers are disordered. Below R = 40 µm, actin fibers take a circumferential orientation. Note the continuity of the actin fibers visible across a cell boundary (B, Inset), demonstrating the mechanical continuity in these pluricellular assemblies. C shows circumferential orientation even though the wire is wrapped up by only one cell. (D) The actin fibers on tracks of similar confinement are oriented along the tracks. (E) The order parameter , quantifies these two opposite trends (different signs of S) at small radii/widths. Note the common horizontal scale used to compare wires and tracks. On wires, the transition between not ordered (R > 40 µm) and ordered (R < 40 µm) is very abrupt. Error bars are SDs. (A, B, and D) Phalloidin-Alexa488 labeling. (C) LifeAct cells.

