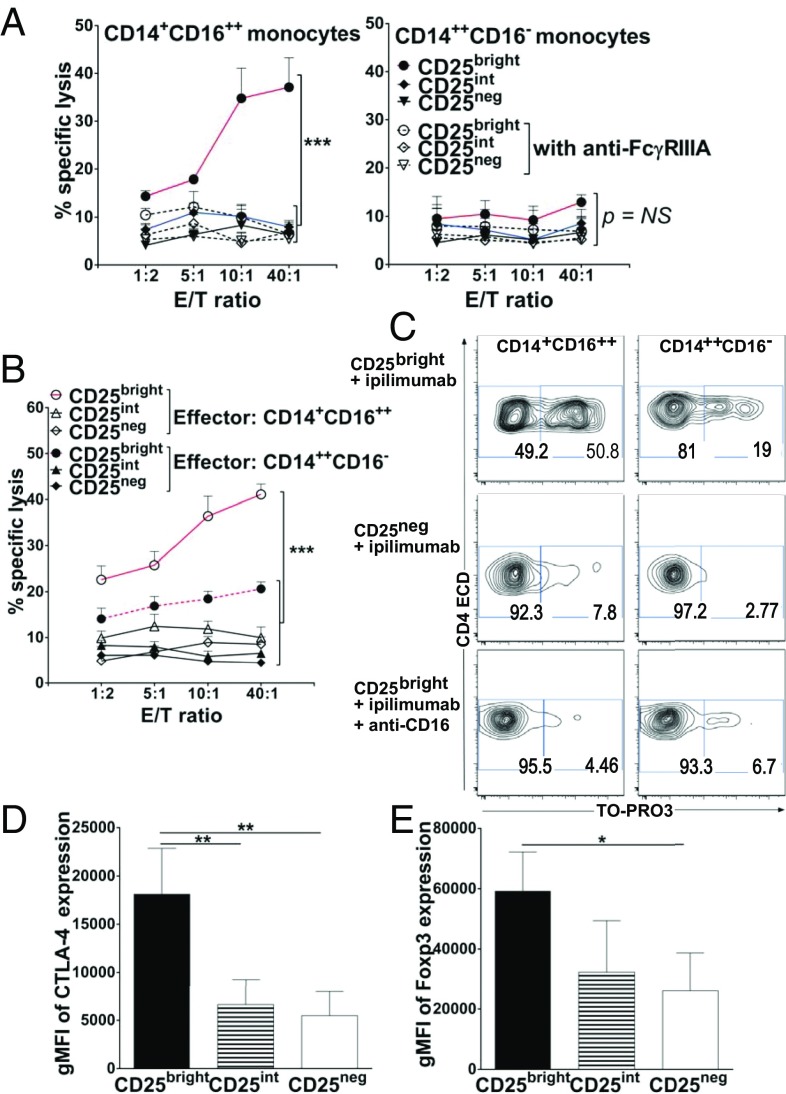
Fig. 2.
Selective FcγRIIIA-dependent lysis ex vivo of Tregs (CD3+CD4+CD25brightCD127−Foxp3++CTLA-4++ Tregs) by nonclassical CD14+CD16++ monocytes. (A) ADCC: killing of sorted CD3+CD4+CD25bright, CD25int, or CD25neg T cells (target) labeled with anti-CD4ECD from healthy donors by purified CD14+CD16++ (Left) or CD14++CD16− (Right) autologous monocytes (effector) at the indicated E:T ratios in the presence of ipilimumab with (open symbols) or without (filled symbols) anti-CD16 blocking Ab. (B) Similar assessment for ADCC of CD3+CD4+CD25bright, CD25int, or CD25neg T cells from patients with melanoma by purified CD14+CD16++ (open symbols) or CD14++CD16− (filled symbols) autologous monocytes. (A–C) ADCC assessments used a flow cytometry-based assay whereby lysed target cells took up an otherwise membrane-impermeable DNA stain, TO-PRO3. Specific lysis was based on the frequency of CD4ECD+ TO-PRO3+ relative to CD4ECD+ TO-PRO3− events. With colorimetric labeling, specific lysis was plotted against the y axes with respect to the E:T ratio shown along the x axes. Data points are the averages ± SEM of triplicate means from three or four independent experiments in three different healthy donors and four different patients with melanoma (***P < 0.001 for pairwise comparisons between CD25bright vs. CD25int or CD25neg T cells targeted by CD14+CD16++ monocytes blocked or not with anti-CD16 for all E:T ratios tested; P value not significant for pairwise comparisons between CD25bright vs. CD25int or CD25neg T cells targeted by CD14++CD16− monocytes blocked or not with anti-CD16 for all E:T ratios tested; ANOVA). (C) Representative ADCC plots at the top E:T ratio for CD25bright and CD25neg T cells from one patient with melanoma and for CD25bright T cells from one normal donor with or without anti-CD16 blocking Ab. (D and E) gMFI of CTLA-4 and Foxp3 expression by sorted CD3+CD4+CD25bright, CD25int, or CD25neg T cells from healthy donors. Mean gMFI measurements of CTLA-4 are 18,100 ± 4,700, 6,600 ± 2,600, and 5,400 ± 2,500 in CD3+CD4+CD25bright, CD3+CD4+CD25int, and CD3+CD4+CD25neg T cells, respectively. Mean gMFI measurements of Foxp3 are 59,300 ± 13,000, 32,300 ± 17,000, and 26,100 ± 12,400 in CD3+CD4+CD25bright, CD3+CD4+CD25int, and in CD3+CD4+CD25neg T cells, respectively. Data represent the averages ± SD from three or four independent experiments (**P < 0.01 and ***P < 0.001, unpaired two-tailed Student t test).

