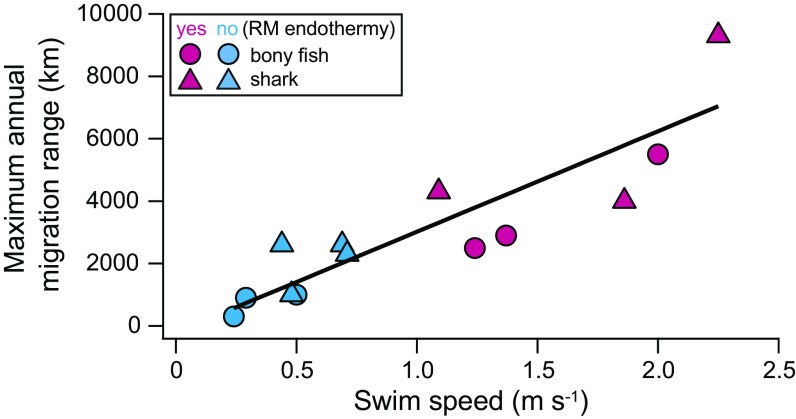
Fig. 3.
The relationship between cruising speed and maximum annual migration range in fishes. Among the species shown in Figs. 1A (cruising speed) and 2 (maximum annual migration range), only 13 species for which both parameters are available are used in this figure. The least-squares regression line is as follows: range = 3,095 × speed – 117.

