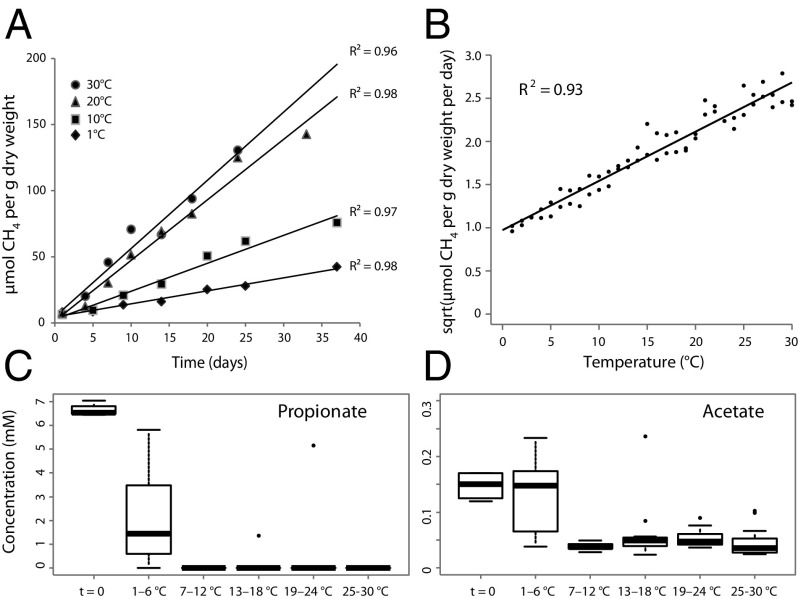
Fig. 1.
(A) Linear regression of CH4 production in Arctic peat soil under anoxic conditions over time at 1, 10, 20, and 30 °C. (B) Linear regression of the plotted Ratkowsky function (square root of the CH4 production rate vs. temperature) for two replicate temperature gradients. (C and D) Boxplots of propionate (C) and acetate (D) concentrations (expressed in millimoles) in soils incubated at temperature windows of 6 °C ranging from 1–30 °C. Measurements from the temperature gradient series A and B are included. Whiskers indicate the most extreme values within 1.5 multiplied by the interquartile range; values outside that range are represented by dots. Box: 25% quartile; median, 75% quartile.

