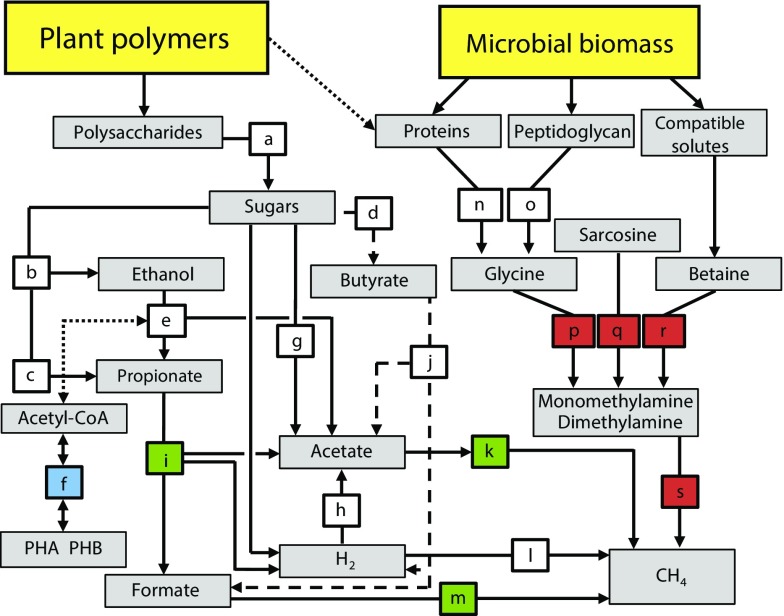
Fig. 6.
Conceptual model displaying the decomposition network of SOM in high-Arctic peat soils. SOM input is from two main sources: plants and microbial cells. The selection of network components is based on the combined information presented in the study, including inhibition studies; measurements of gases, organic acids, and ethanol; enzyme assays; metatranscriptomics; and metagenomics. Each colored box represents a biochemical transformation of a substrate (origin of arrow) to a product (end point of arrow). Dashed lines indicate a less prominent pathway (i.e., butyrate oxidation). The dotted line indicates putative links between metabolisms/pools (ethanol oxidation and PHB metabolism; availability of plant cell wall proteins). The color coding is based on the identified temperature responses. Blue: decrease in transcription; red: increase in transcription; green: a switch in the taxa responsible, with consequences for propionate and acetate metabolisms; white: no clear change. Pathways are indicated by letters a–s: a, hydrolysis; b, c, and d, primary fermentations; e, ethanol fermentation to propionate and acetate or to acetate and H2; f, PHB metabolism; g and h, acetogenesis; i, propionate fermentation to acetate, formate, and H2 or to acetate and H2; j, butyrate fermentation to acetate, formate, and H2 or to acetate and H2; k, methanogenesis from acetate; l, methanogenesis from H2 and CO2; m, methanogenesis from formate; n, proteolysis; o, penta-glycine proteolysis; p, glycine cleavage/degradation; q, sarcosine reduction; r, betaine reduction; s, methanogenesis from methylamines.

