
Fig. 2.
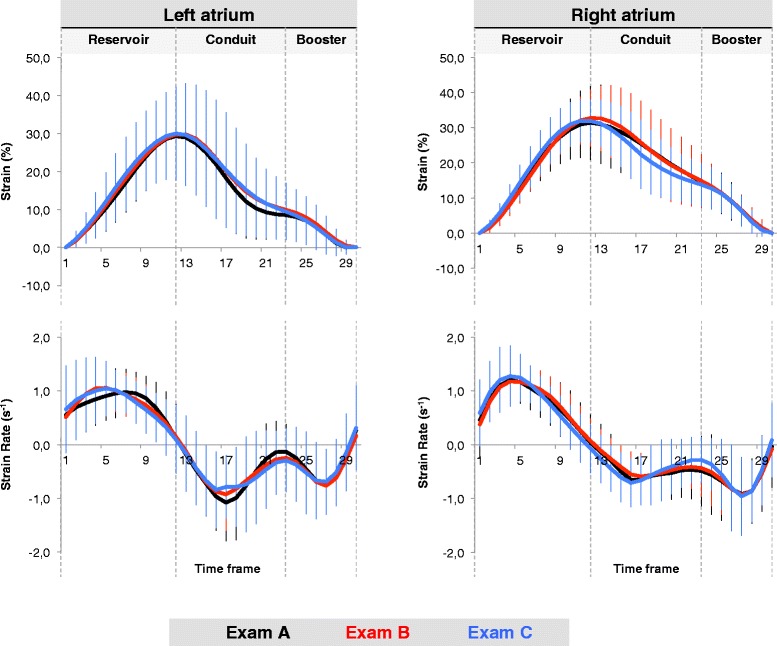
Atrial strain and strain rate profiles. Left and right atrial strain and strain rate profiles are displayed for all three Exams A-C. The three curves displayed for each parameter represent an average of the whole study group for the first, the second and the third CMR examination (Exams A-C) respectively (please see colour codes)